What is Fibonacci?
Fibonacci is a sequence of numbers that are related to each other.
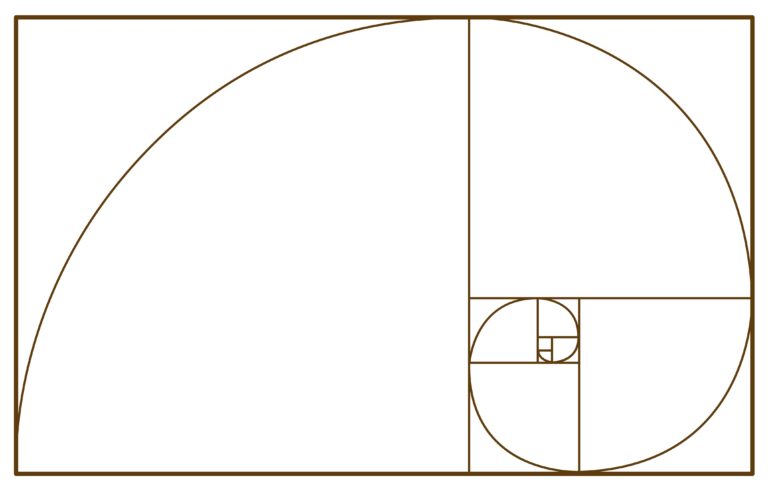
It was discovered by Leonardo Pisano Fibonacci, an Italian mathematician. Each number in the sequence is the sum of the two preceding numbers.
For example: 0 + 1 = 1, 1 + 1 = 2, 2 + 1 = 3, 3 + 2 = 5, and so on. The pattern continues as 0, 1, 1, 2, 3, 5, 8, 13, 21, 34, 55, 89, 144, etc. The numbers in this sequence follow a spacing based on a rule known as the “Golden Ratio.”
In trading, the Fibonacci sequence is used to measure important price levels on charts. This sequence helps traders identify entry and exit points for orders as well as set buy and sell levels, take profit (TP), and stop loss (SL) levels.
What is Fibonacci Retracement?
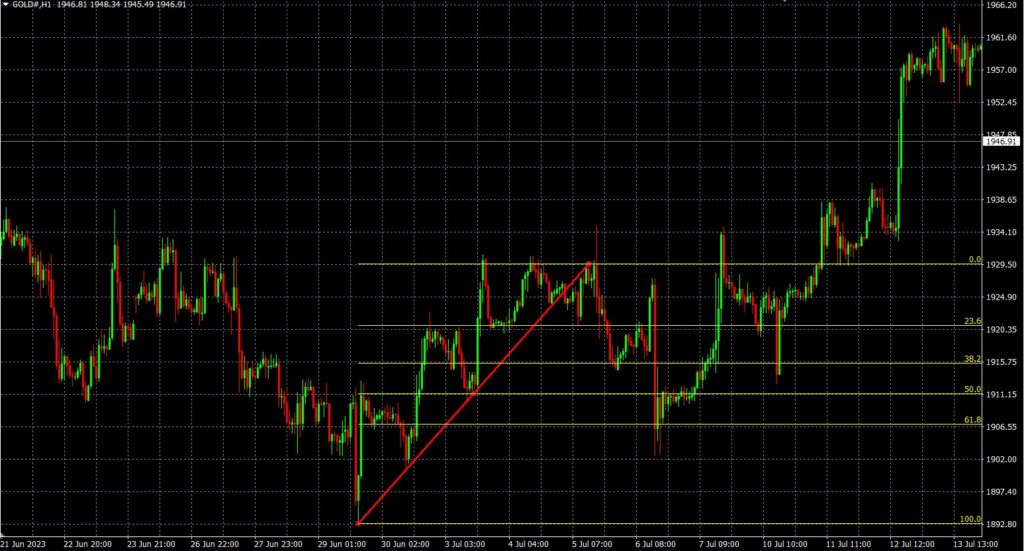
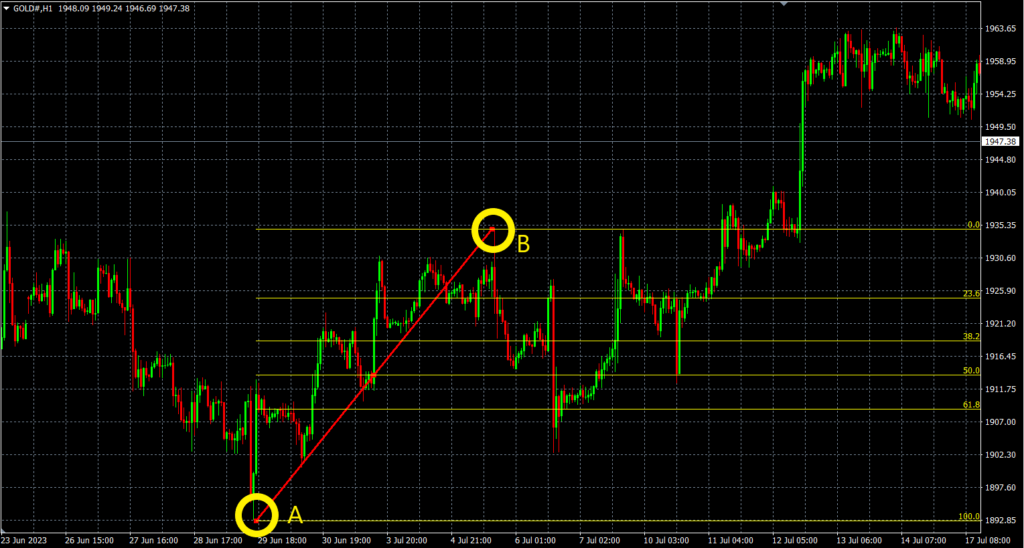
Fibonacci retracement is a set of lines that indicate psychological support and resistance levels, showing points where the price is likely to retrace or pause. The key Fibonacci retracement levels are 0%, 23.6%, 38.2%, 50%, 61.8%, and 100%. These levels represent areas where the price has a high chance of pulling back before continuing in the direction of the main trend.
Using Fibonacci Retracement
You can activate it in MT4 by going to the menu Insert > Fibonacci > Fibonacci Retracement.
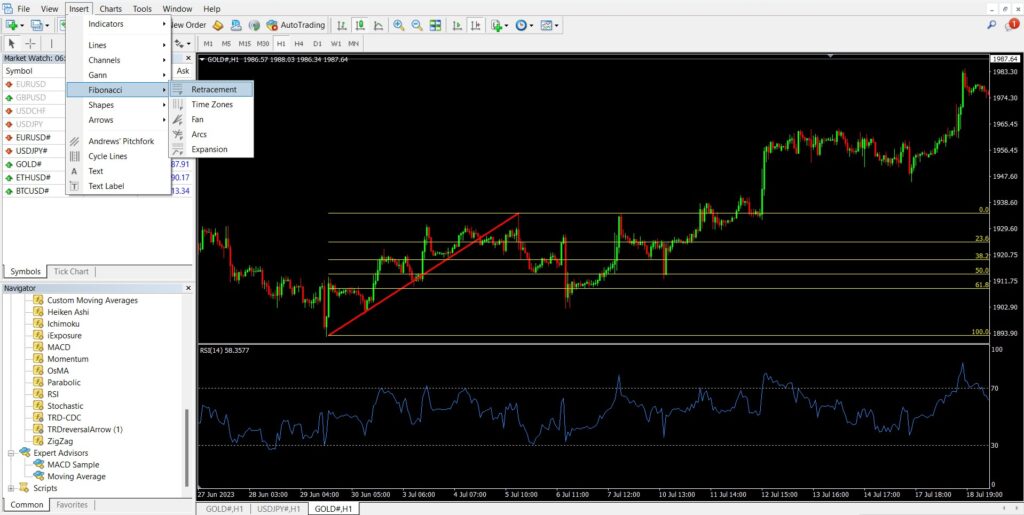
Next, we observe the current trend. If it’s an uptrend, we draw the Fibonacci retracement from the recent swing Low to High. If it’s a downtrend, we draw from High to Low, or from point A to B as shown in the picture. This will give us the Fibonacci levels at 0%, 23.6%, 38.2%, 50%, 61.8%, 100%, and 161.8%.
How to Trade Using Fibonacci Retracement
Fibonacci Retracement is an important tool that many traders use to identify potential price pullback levels. It helps analyze significant price levels or find possible support and resistance zones based on the Fibonacci lines. As mentioned earlier, the main way to use it is to trade with the trend. Traders use the Fibonacci lines as support and resistance levels to find entry points as well as to set Take Profit (TP) or Stop Loss (SL) levels according to the Fibonacci retracement levels.
For example, if the market is in an uptrend, traders use Fibonacci to measure the pullback levels of the price to find good opportunities to open a Buy order or to set the SL just below the Fibonacci line. Conversely, if the market is in a downtrend, Fibonacci is used to measure the retracement levels upward, helping traders find good points to open a Sell order or set the SL just above the Fibonacci line.