The Relative Vigor Index, or RVI for short, is an indicator classified as an oscillator. It is used to measure the strength of a trend and can also indicate the price trend during a certain period.
How to activate the Relative Vigor Index (RVI)
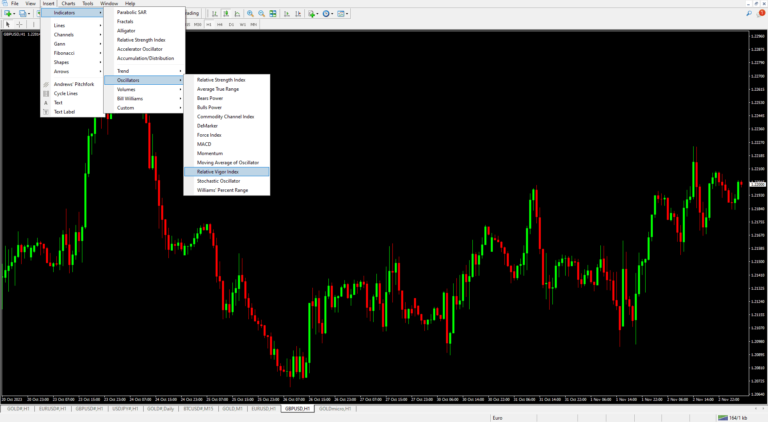
How to use: You can activate it in MT4 by going to Insert > Indicator > Oscillator > Relative Vigor Index.
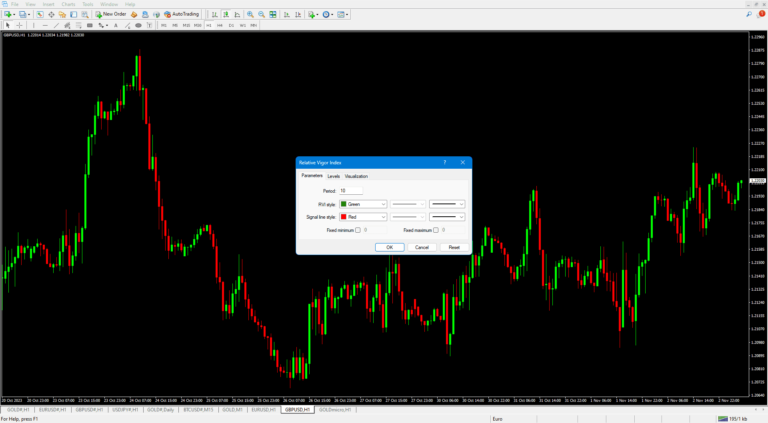
For the settings, you can use the default Period 10 as preset by the system.
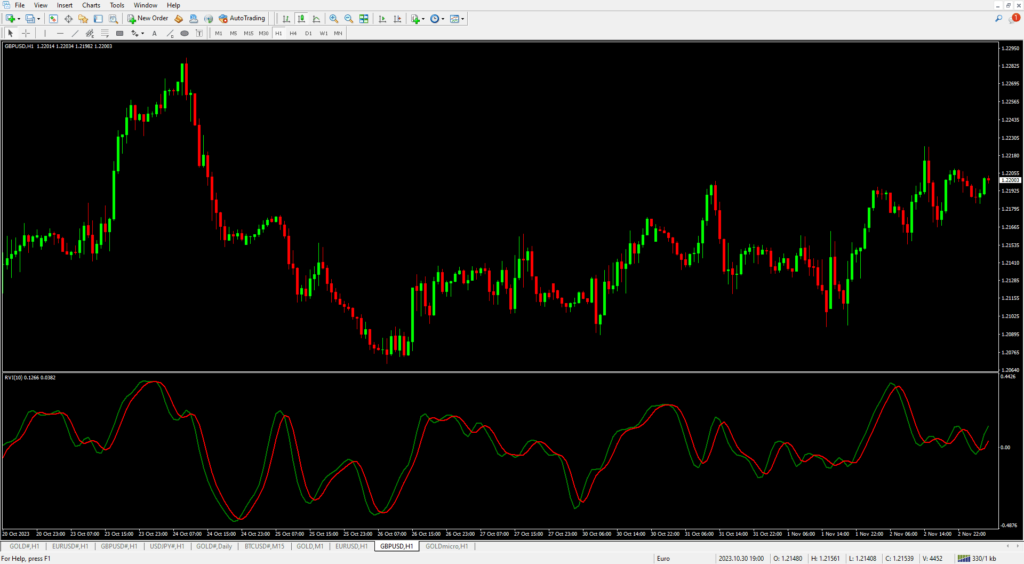
After that, we will see the RSI Indicator window. When opening the RVI, we will see green and red lines crossing up and down. We use these lines as signals to observe the trend and the strength of the price.
How to use the Relative Vigor Index (RVI)
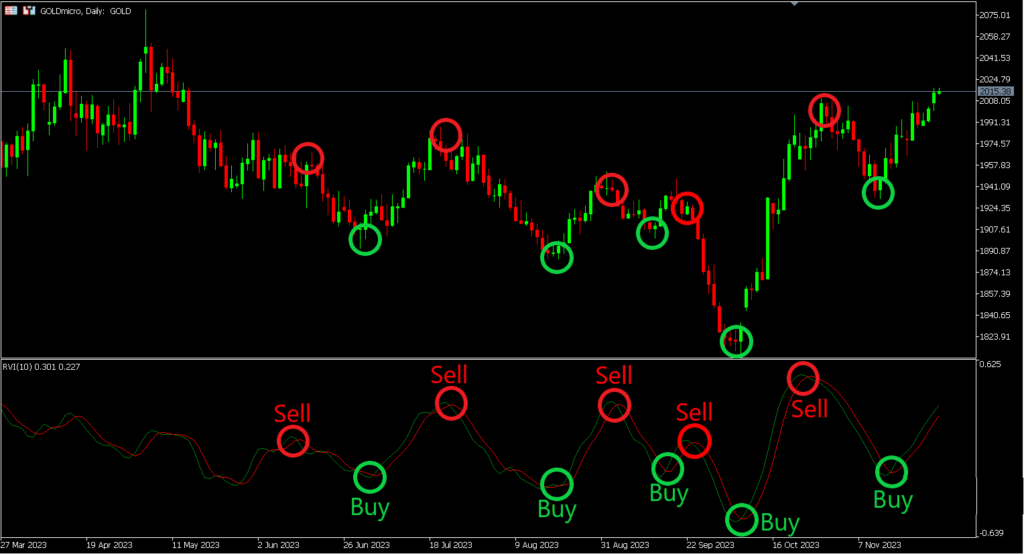
Used as a signal for opening and closing orders.
The way traders use the RVI is mainly to observe the buying and selling pressure in the market at a given time. The indicator uses a green line and a red line to show the volume of buying and selling. If the green line crosses above the red line, it means that there are more buyers than sellers in the market at that moment, indicating a potential uptrend. Traders may use this signal to consider opening a Buy order. Conversely, if the green line crosses below the red line, it means there are more sellers than buyers, indicating a possible downtrend. Traders may use this signal to consider opening a Sell order.
As for setting Take Profit (TP) and Stop Loss (SL) points, you can decide how much risk you are willing to take and how much profit you want to aim for. This indicator allows flexible profit management, where you can set a specific TP or use a Trailing Stop to lock in profits.
Tutorial video on how to use the Relative Vigor Index (RVI)