What are Double Top and Double Bottom?
Double Top and Double Bottom are chart patterns that show reversal behavior in candlestick price movements within both uptrends and downtrends. Most investors and traders use these reversal patterns to identify entry points and plan their trades based on the neckline, where the price breaks below or above.

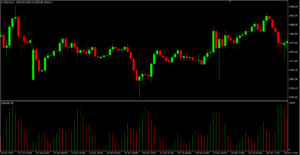
What is a Double Top?
A Double Top is a reversal pattern that usually appears in an uptrend and signals a change to a downtrend. This pattern resembles the letter “M” and consists of two swing highs: the first swing high (Top 1) is the previous highest price, and the second swing high (Top 2) is a peak close to the first. Between them, there is a swing low in the middle.

When trading with the Double Top pattern, if the chart is in an uptrend (making higher highs) and shows the characteristics described above, traders should draw the neckline at the lowest point (Swing Low) between the two highs. You can enter a Sell order when the price breaks down below the neckline. Alternatively, you can wait for the price to break below the neckline, then retrace back up to touch the neckline before entering a Sell order.
What is a Double Top?
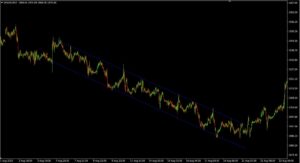
Double Bottom is a reversal pattern that usually occurs in a downtrend and signals a potential shift to an uptrend. This pattern resembles the shape of the letter “W,” with two Swing Low points: Bottom 1, which forms the previous lowest price, and Bottom 2, which forms a low price close to the first. Between these two lows, there is a Swing High point in the middle.

When trading with the Double Bottom pattern, if the chart is in a downtrend (making lower lows) and the pattern described above appears, traders should draw the Neckline at the highest price point (Swing High) between the two lows. Then, a Buy order can be placed when the price breaks out above the Neckline. Alternatively, traders can wait for the price to break out above the Neckline, then pull back to touch the Neckline again before entering a Buy order.

Observing chart patterns like the Double Top or Double Bottom can provide strong reversal signals. After the price breaks out of the Neckline from the highest or lowest points, it often pulls back to test the Neckline again. When the Neckline turns into a support or resistance level, there is a high probability that the price will reverse and change its trend, especially if it fails to break through the Neckline once more.