What are Bollinger Bands?
Bollinger Bands are a technical analysis tool developed by John Bollinger, commonly used to analyze trends and price volatility in financial markets. The main components of Bollinger Bands include a Simple Moving Average (SMA) line and two bands plotted above and below it based on the standard deviation, which measure the price’s upper and lower volatility boundaries.
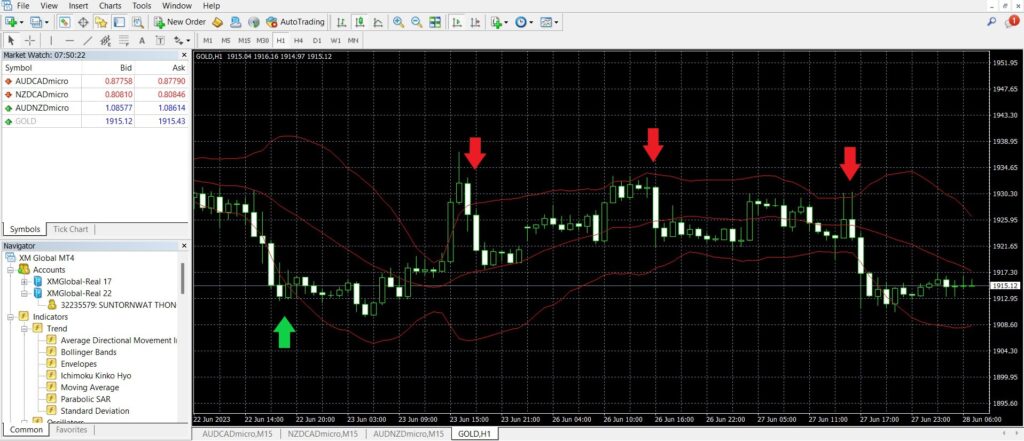
You can enable Bollinger Bands in MetaTrader 4 (MT4) by navigating to the menu: Insert > Indicators > Trend > Bollinger Bands.
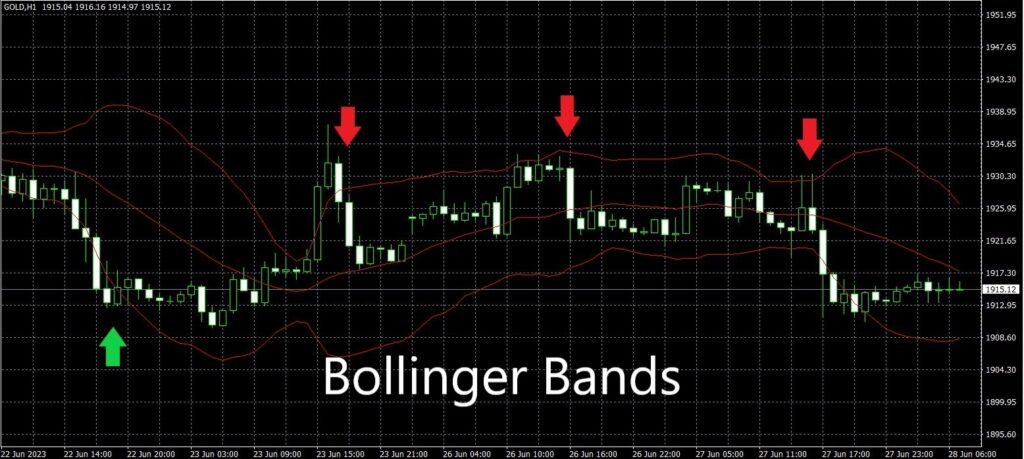
Bollinger Bands help traders identify risk levels and potential buying or selling opportunities in the market. When the price touches or moves above the upper band, it may indicate that the asset is overbought, which could be a signal for traders to consider a sell position. Conversely, when the price touches or drops below the lower band, it may indicate that the asset is oversold, potentially signaling a buy opportunity.
How are Bollinger Bands calculated?
1.Calculate the Simple Moving Average (SMA):
Use a specified period (e.g., 20 days). Add the closing prices of the past 20 days and divide the sum by 20 to get the average closing price for that period.
2.Calculate the Standard Deviation:
Use the same period as used in the SMA. This involves calculating the standard deviation of the closing prices over that time frame to measure price volatility.
3.Calculate the Upper Band:
Use the formula: Upper Band = SMA + (Standard Deviation × 2)
4.Calculate the Lower Band:
Use the formula: Lower Band = SMA – (Standard Deviation × 2)
Therefore, once the SMA and standard deviation are calculated, the Bollinger Bands can be plotted, with the Upper Band and Lower Band appearing above and below the SMA line, respectively.
What is the main purpose of Bollinger Bands?
Bollinger Bands are a tool used to visualize price volatility and help traders analyze market conditions. The main purposes of Bollinger Bands are as follows:
1.Identifying Price Trends:
Bollinger Bands help identify price trends, whether upward or downward, by observing whether the price is moving near the upper or lower band. The movement of the middle line (usually a 20-period SMA) allows traders to assess the overall market trend.
2.Measuring Volatility:
Bollinger Bands are useful in measuring price volatility. When the bands expand, it indicates increased volatility; when they contract, it signals reduced volatility. Traders can use this information to gauge market conditions and adjust their trading strategies accordingly.
3.Identifying Overbought and Oversold Conditions:
Bollinger Bands can indicate overbought and oversold conditions. If the price touches or crosses above the upper band, it may signal an overbought condition, suggesting a potential reversal or correction. Conversely, if the price touches or breaks below the lower band, it may indicate an oversold condition and a potential buying opportunity.
4.Setting Stop Loss and Take Profit Levels:
Bollinger Bands can assist traders in setting appropriate Stop Loss and Take Profit levels.
The bands provide a reference range for price movement, allowing traders to place Stop Loss orders below the lower band or Take Profit targets near the upper band.
Are Bollinger Bands a complete trading strategy?
Bollinger Bands can be used as a standalone trading strategy, but it is generally recommended to use them in conjunction with other technical indicators and analysis techniques. While Bollinger Bands provide valuable information about price volatility, trend identification, and potential reversal points, relying solely on this tool may not offer a complete trading strategy.