what is CDC Action Zone?
CDC Action Zone is an indicator developed to signal entry points for buying and selling according to various market trends. It was created by a Thai trader, Uncle Chaloak, who is considered one of the successful and well-known Forex traders in Thailand.

How to use CDC Action Zone
It can be used in TradingView by going to the Indicator menu > CDC Action Zone V3 2020, the latest version, and clicking to use it. This indicator is derived from the EMA 12 and EMA 26 lines, which indicate various trend directions, to calculate entry points for more accurate profit-taking.

When you open it up, you’ll see the lines of the indicator and the colors according to the various candlesticks that indicate the operation of this indicator. Each color has a different meaning.

-A red candlestick is a candlestick that tends to be bearish.
-The green candlestick is a candlestick that tends to be bullish.
-Orange candlestick, yellow candlestick are upward candlesticks that are likely to reverse into a downward trend.
-The blue and light blue candlesticks are downward candlesticks that are likely to reverse into an upward trend.
Using the CDC Action Zone to make a profit
CDC Action Zone is an easy-to-use indicator that accurately indicates entry points based on various trends, making it quite popular among many traders. However, it is not recommended to use it in small timeframes (TF) as it cannot clearly show the trend of the graph. Therefore, it is recommended to use it in larger timeframes, such as H1 and above, to get a clearer view of the graph’s trend.
Signal to enter a Buy order

When the graph is in an uptrend, the green dots of the indicator appear below the green candlesticks. Then, there is a signal from the red EMA line crossing above the blue line as shown in the image. This indicates that we can enter a Buy order.
Signal to enter a Sell order
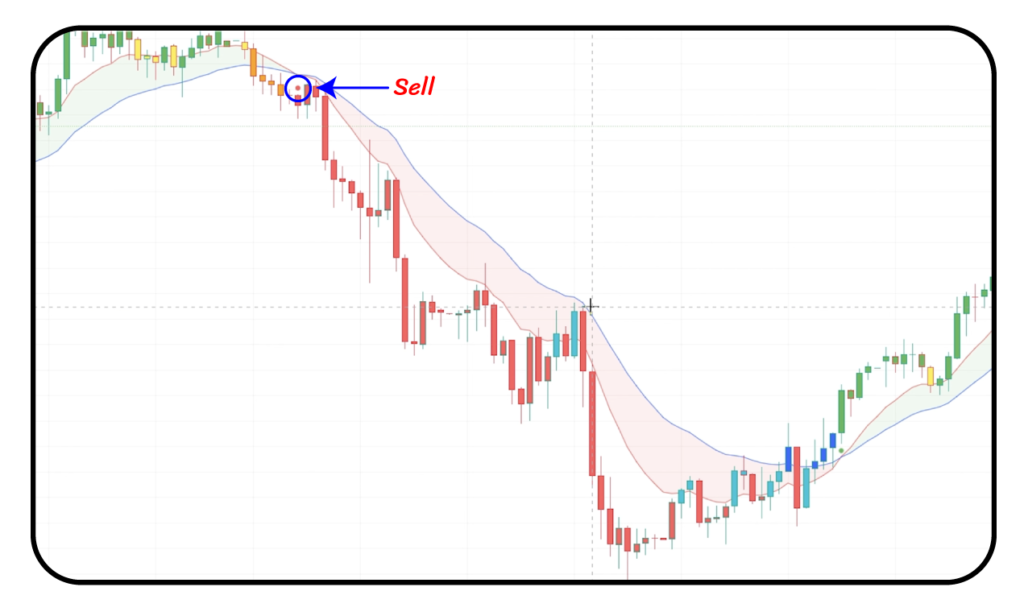
When the graph is in a downtrend, a red dot of the indicator appears above the red candlestick chart. Then, there is a signal from the blue EMA line crossing below the red line as shown in the image. This indicates that we can place a Sell order.
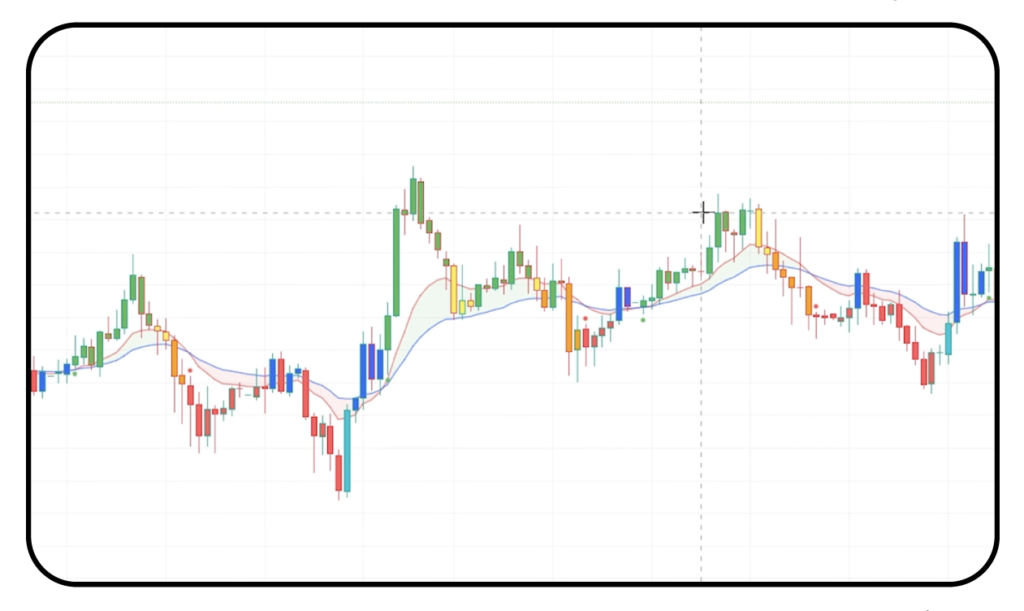
CDC Action Zone is very suitable for trading clear trend movements, but not so much for sideways market trends. This could lead to indicators giving false order signals. Therefore, I recommend avoiding orders from CDC Action Zone if you encounter a sideways market.