What is a Demand & Supply Zone?
Demand & Supply Zone is a profit-making technique based on marking price zones to identify buying (demand) and selling (supply) pressure. These forces of demand and supply reflect the market participants’ intentions — indicating whether there is stronger buying or selling interest at a given time. By identifying these zones, traders can draw price boundaries, and when the price returns to touch these levels, they use that point as a signal to consider entering a trade.
Candlestick Characteristics of Demand & Supply
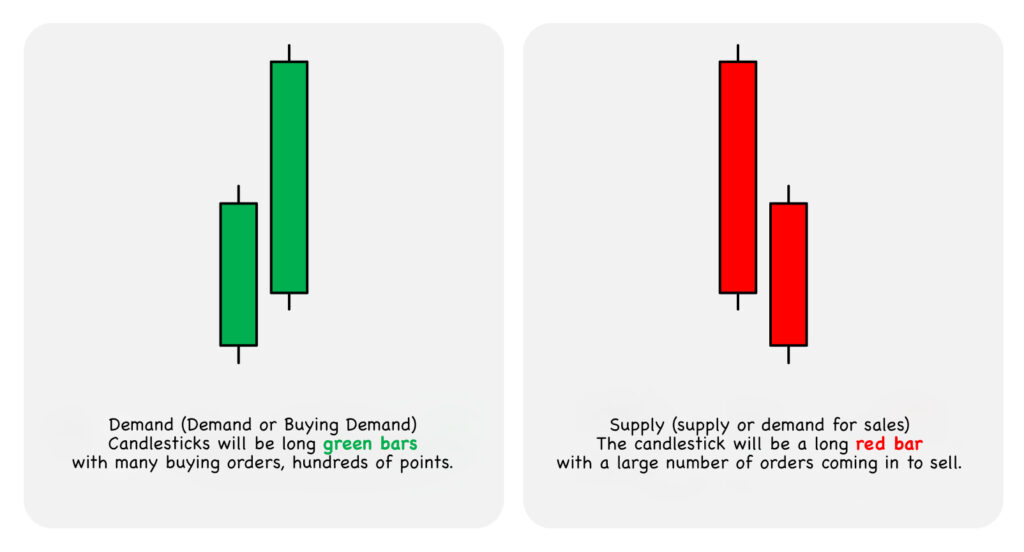
Demand refers to the market’s desire to buy. The candlestick typically appears as a long green bar, indicating strong buying interest with orders entering the market over several hundred points.
Supply refers to the market’s desire to sell. The candlestick typically appears as a long red bar, showing strong selling pressure with a large number of sell orders in the market.
Pattern and Framing of the Demand Zone
The Demand Zone can be categorized into two types.
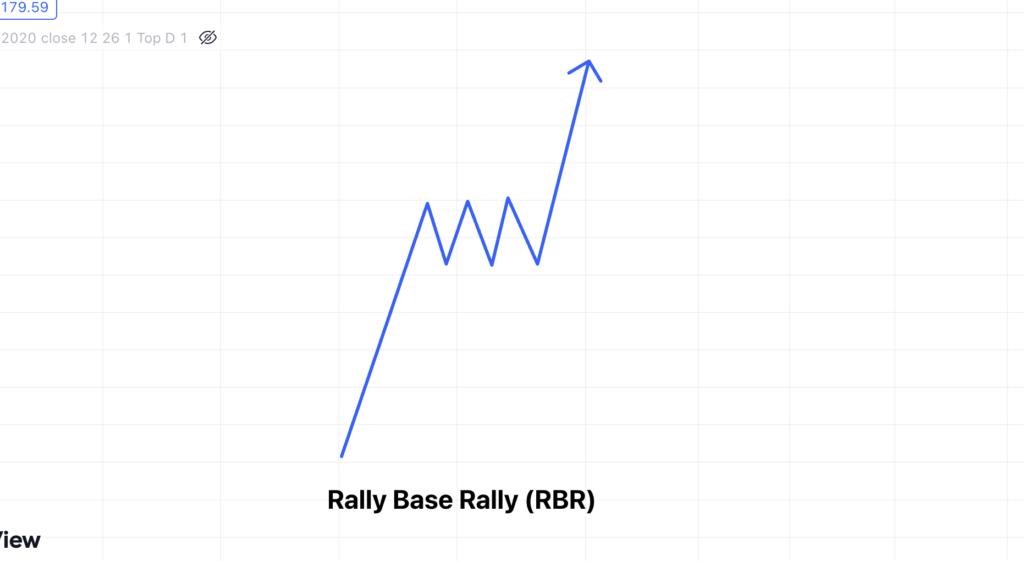
Rally Base Rally (RBR)
The RBR pattern appears on a chart when the price makes an upward move (Rally), followed by a consolidation or pause (Base), and then continues to rise again (Rally). This pattern typically occurs during a strong uptrend (major trend).
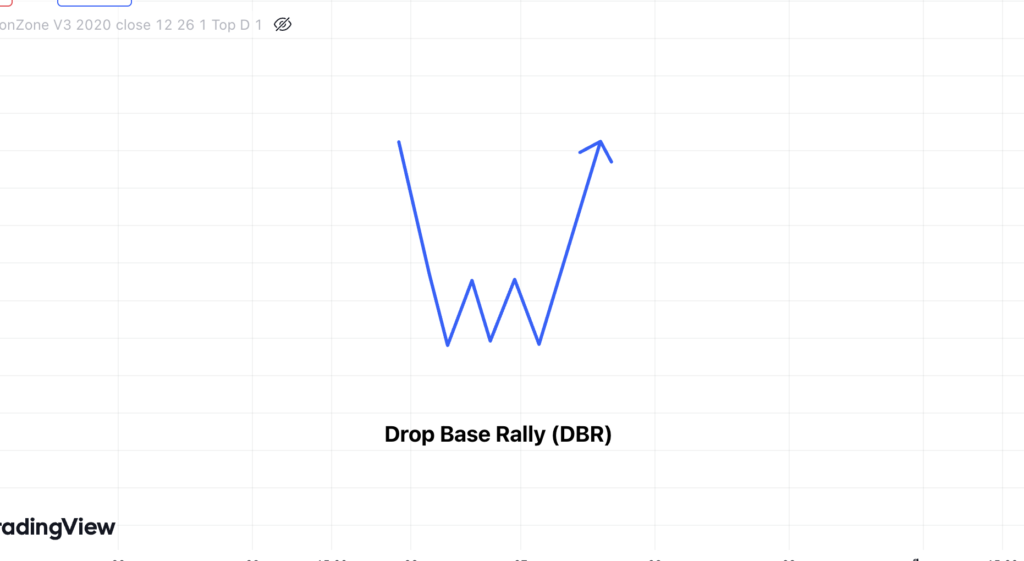
Drop Base Rally (DBR)
A DBR pattern on the chart is characterized by a drop in price, followed by a base or consolidation phase, and then a rally or upward movement. This pattern typically occurs during an overall uptrend and represents a temporary pullback or consolidation within the larger trend.
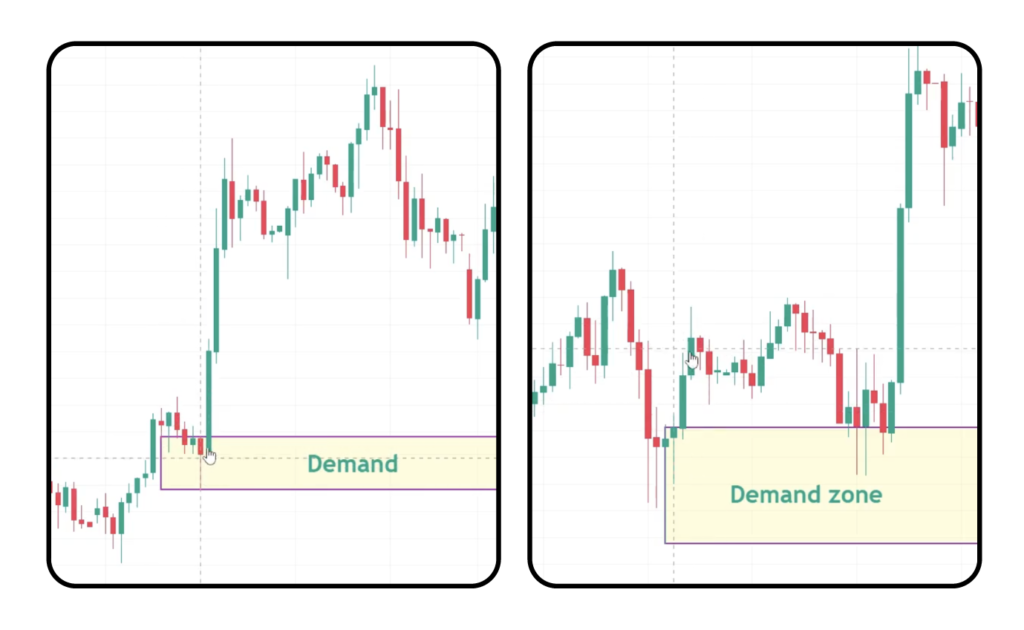
When encountering this type of chart pattern, traders will draw a zone around the base area where the price consolidates. The lower boundary of the zone is drawn from the lowest wick, while the upper boundary is drawn from the body of the last candle before the price breaks out either upward or downward. This creates a Demand Zone. Then, the trader waits for a Buy opportunity when the price moves back down and touches the Demand Zone.
The formation and outlining of the Supply Zone.
The characteristics of a Supply Zone can also be divided into two types.
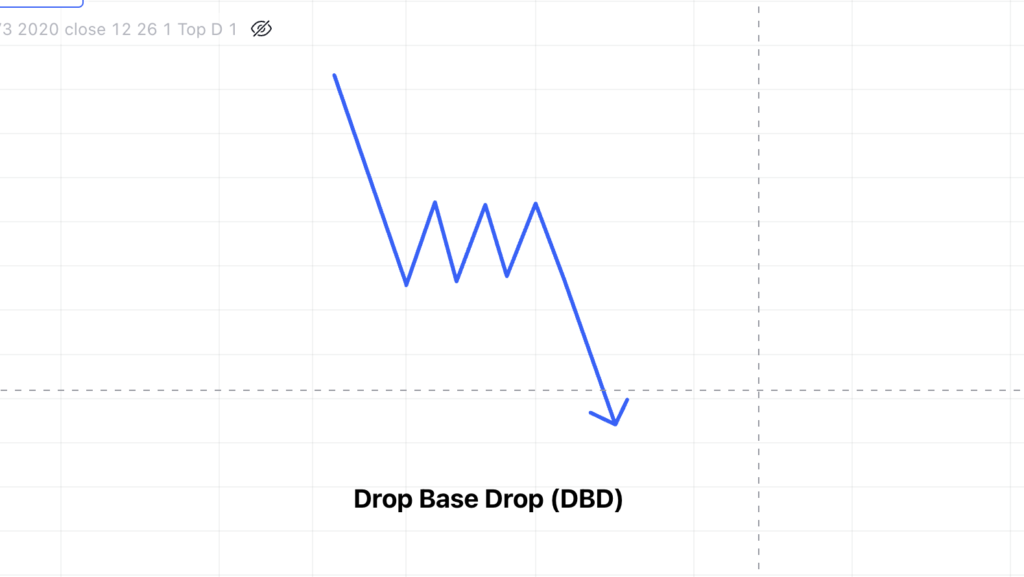
Drop Base Drop (DBD)
The DBD pattern on the chart shows a drop (price decline), followed by a base (consolidation or pause), and then another drop (further decline). This pattern usually occurs during a downtrend (major bearish trend).
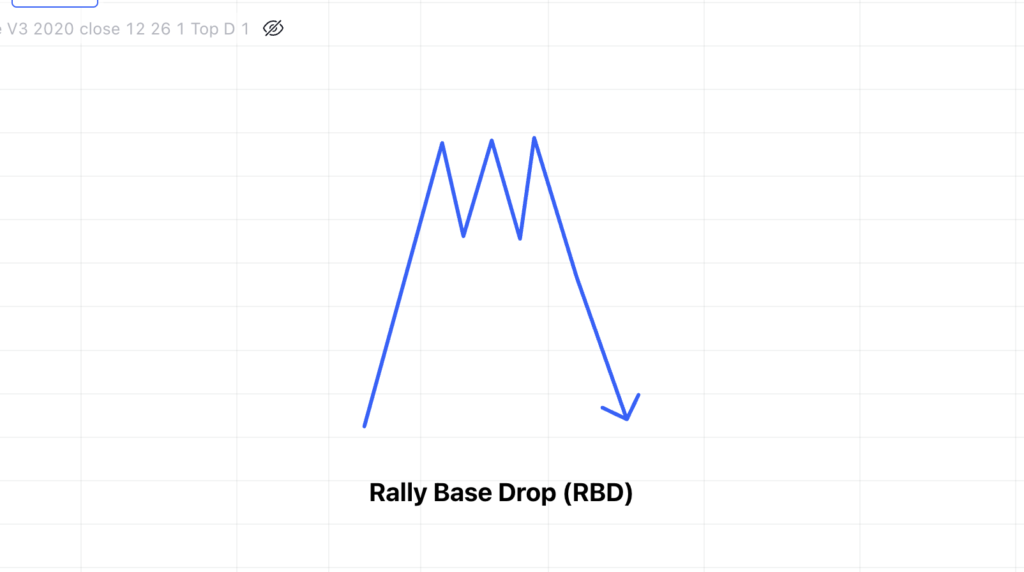
Rally Base Drop (RBD)
The RBD pattern on the chart shows a rally (price moves up), followed by a base (consolidation or pause), and then a drop (price moves down). This pattern usually occurs during a downtrend when the market is taking a brief pause within the larger trend.
Understanding the 2 behaviors of the market
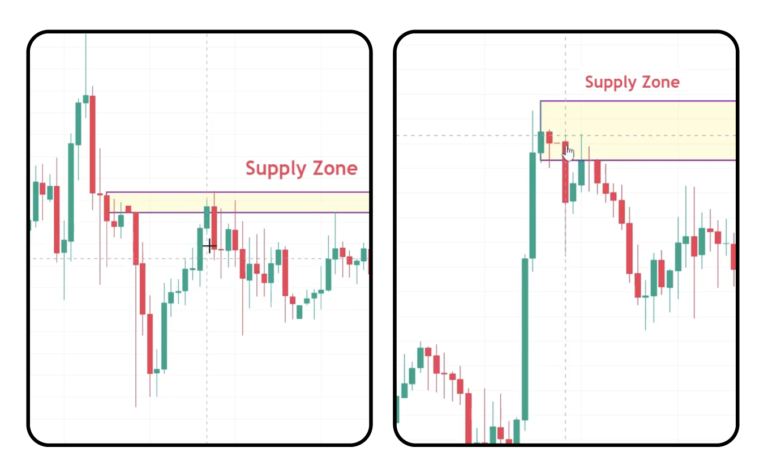
When encountering a chart like this, the way to mark the zone is similar to a Demand Zone. You start by marking the area where the price consolidates (the base). The upper boundary is drawn at the highest wick, while the lower boundary is drawn at the body of the last candlestick before the price shoots up or down. This creates a Supply Zone. Then, wait for the right moment to enter a Sell order when the price moves down and touches the Supply Zone line.