What is Divergence?
Divergence is a characteristic of the conflict that occurs between the price chart and various technical tools or indicators that do not move in the same direction. The signals that arise here often indicate a reversal of the price chart in different trends, from an uptrend to a downtrend or from a downtrend to an uptrend. Traders will use the reversal signals from Divergence to plan their trades in the upcoming new trend.

Using Divergence in Trading
The types of Divergence are divided into 2 categories. The indicators commonly used to observe Divergence are mostly those in the Oscillator category, such as RSI and MACD, which are the indicators I use the most to find reversal signals.
Bearish Divergence
It is a signal of a price chart reversal when the price chart keeps making new highs, but at the same time, the movement of the indicator gradually decreases. This is a signal indicating that the price chart is likely to reverse from an uptrend to a downtrend.

Example of Bearish Divergence in an Uptrend: When the price chart continuously makes new highs in an uptrend, but the movement of the RSI is declining and the MACD histogram is also decreasing.

It is a confirmed signal that the buying momentum in the uptrend seen in both indicators is about to run out. Therefore, there is a very high chance that the graph will reverse into a downtrend. Traders might plan their trades in this downtrend to enter Sell orders.
Bullish Divergence
It is a signal of a price chart reversal when the price chart keeps making new lows, but at the same time, the movement of the indicator gradually rises. This is a sign indicating that the price chart is likely to reverse from a downtrend to an uptrend.
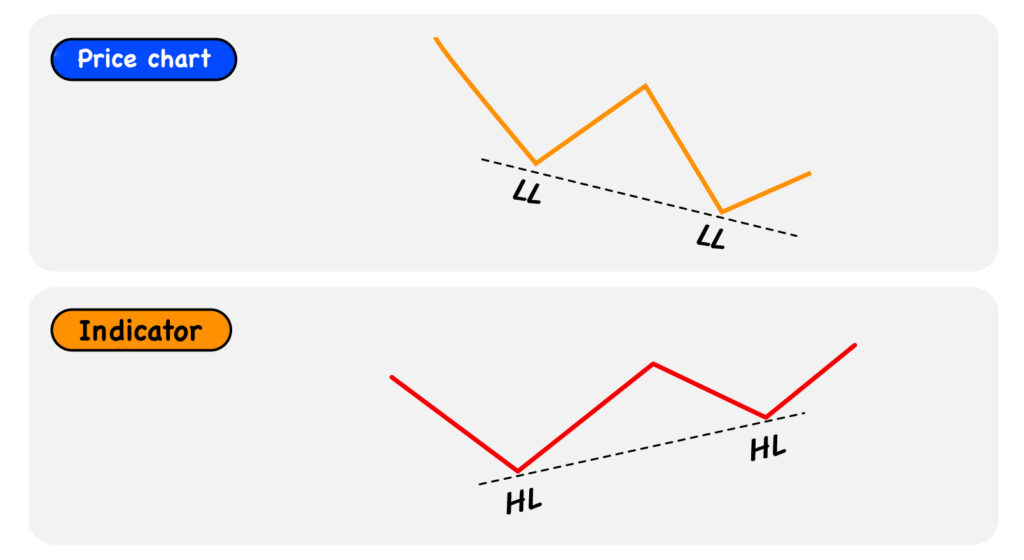
Example of Bullish Divergence in a Downtrend: When the price chart keeps making new lows in a downtrend, but the movement of the RSI is rising, and the MACD histogram is also increasing.
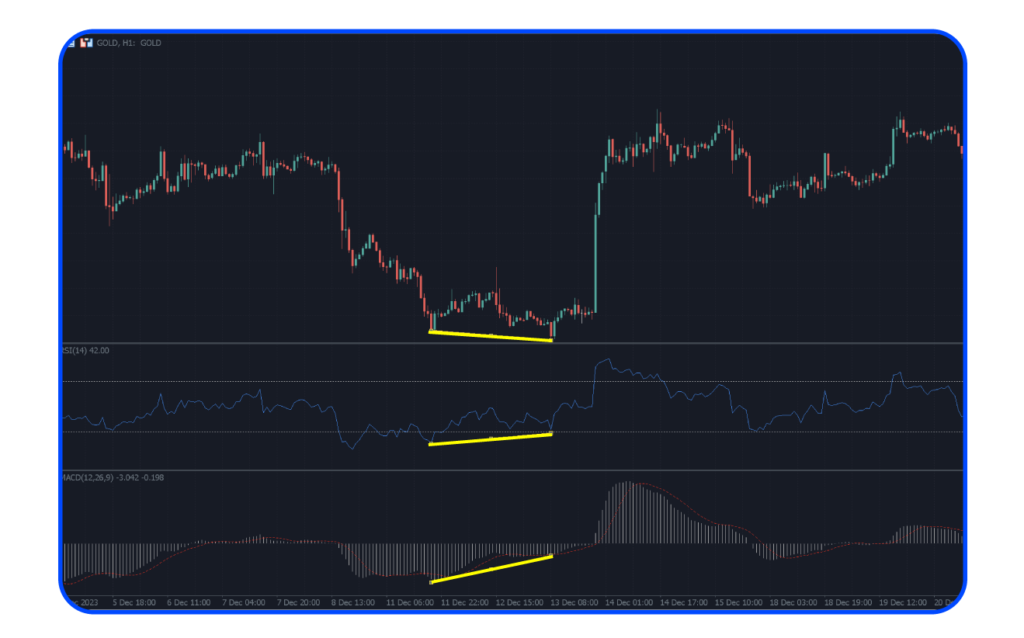
It is a confirmed signal that the selling pressure in the downtrend seen in both indicators is about to end, and buying pressure is coming in instead. Therefore, there is a very high chance that the graph will reverse into an uptrend. Traders might plan their trades in this uptrend to enter Buy orders.