Ichimoku Kinko Hyo, also known as the Ichimoku Cloud, is a comprehensive technical analysis tool that provides deep insights into market trends, support and resistance levels, and potential profit opportunities. It consists of several components, including Kumo, Tenkan-sen, Kijun-sen, Senkou Span A, and Senkou Span B.
Using the Ichimoku Kinko Hyo Indicator in Forex Trading
Please help analyze the price trend.
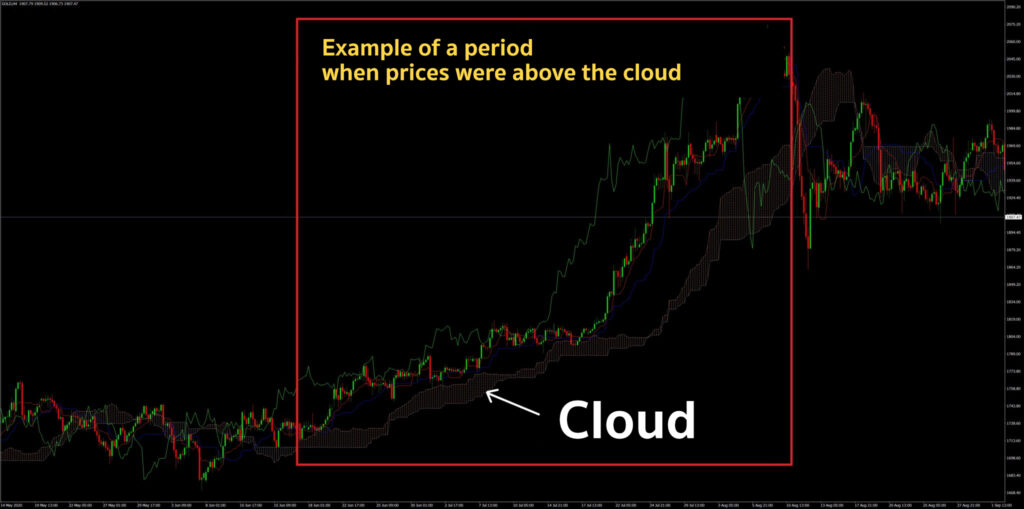
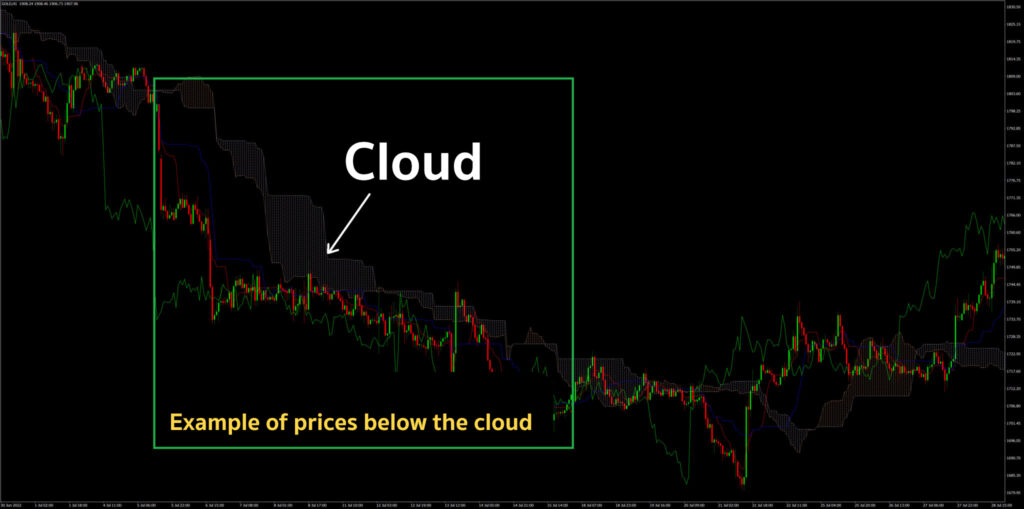
Ichimoku Kinko Hyo is particularly useful for identifying the direction and strength of a price trend. If the price is above the cloud, it indicates an uptrend; if the price is below the cloud, it suggests a downtrend. Traders can use this information to make trading decisions that align with the overall market direction, thereby increasing their chances of making profitable trades.
Used to identify support and resistance levels.
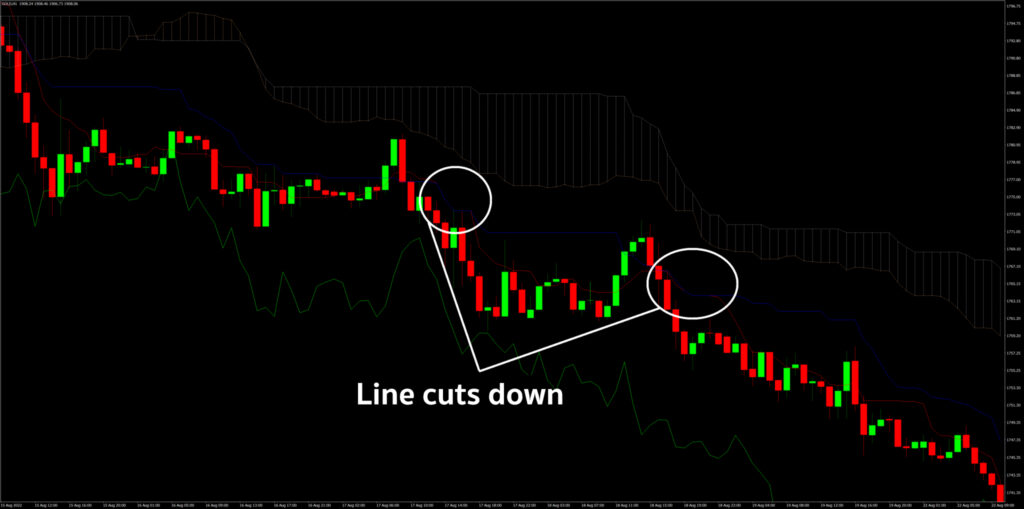
The Kumo, or Cloud, formed by Senkou Span A and Senkou Span B, serves as dynamic support or resistance. When the market is in a downtrend, the upper boundary of the cloud acts as resistance. Traders can use this feature to identify potential entry points, take-profit targets, or stop-loss levels.
Used as a signal to indicate buy and sell opportunities.
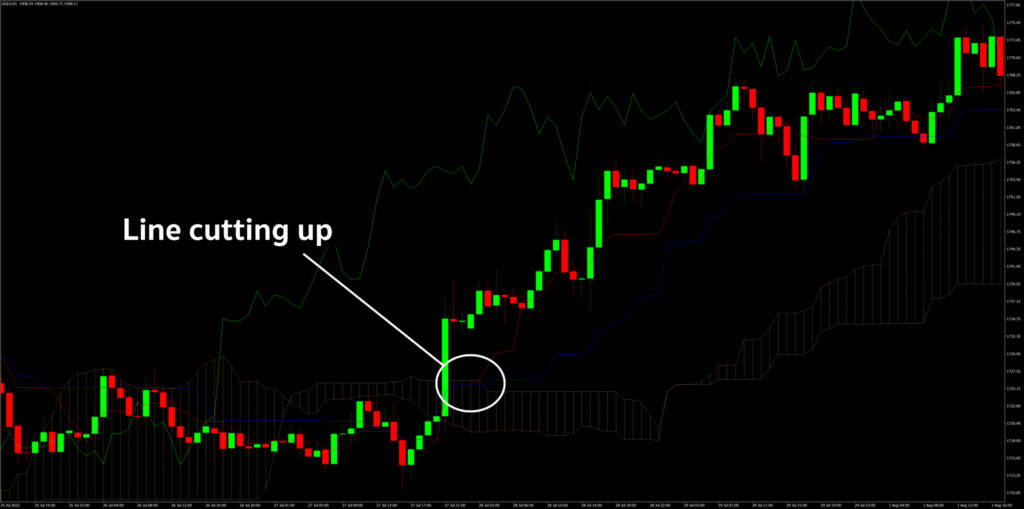
The crossover between the Tenkan-sen and Kijun-sen lines can be used as a trading signal. For example, when the Tenkan-sen crosses above the Kijun-sen, it generates a buy signal. Conversely, when the Tenkan-sen crosses below the Kijun-sen, it generates a sell signal. These crossovers can be used in combination with other indicators or trading strategies to improve the accuracy of trading decisions.
Time and Price Analysis
The Ichimoku Kinko Hyo can be used to assess the strength of a price trend by looking at the Chikou Span line. If the Chikou Span is below the price, it signals that the downtrend is strong. Conversely, if the Chikou Span is above the price, it indicates that the uptrend is strong.