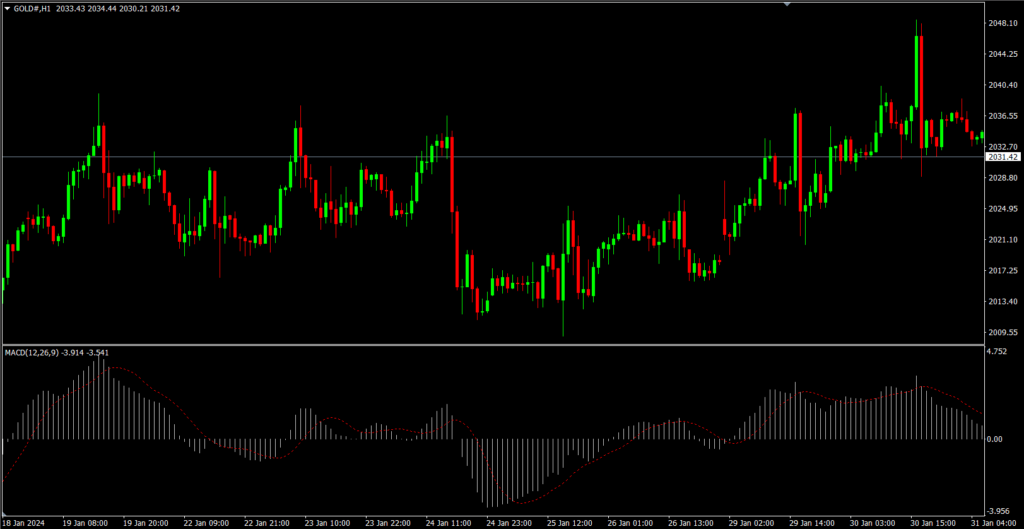
MACD, or Moving Average Convergence Divergence, is one of the technical tools used to analyze price charts of securities. Traders commonly use it to analyze price trends and price momentum.
How to activate MACD
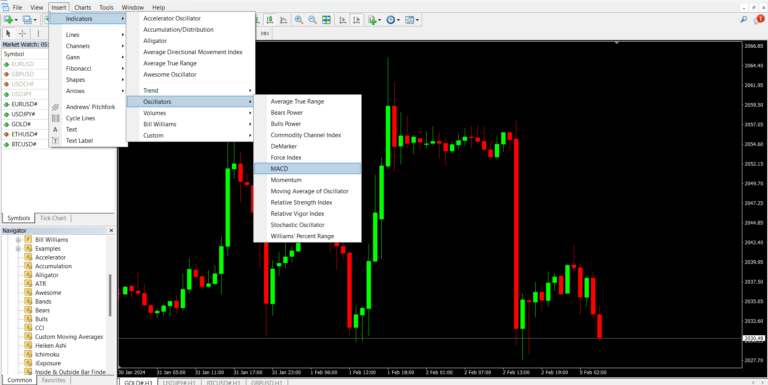
You can activate MACD on MT4 or MT5 by going to Insert > Indicator > Oscillator > MACD.
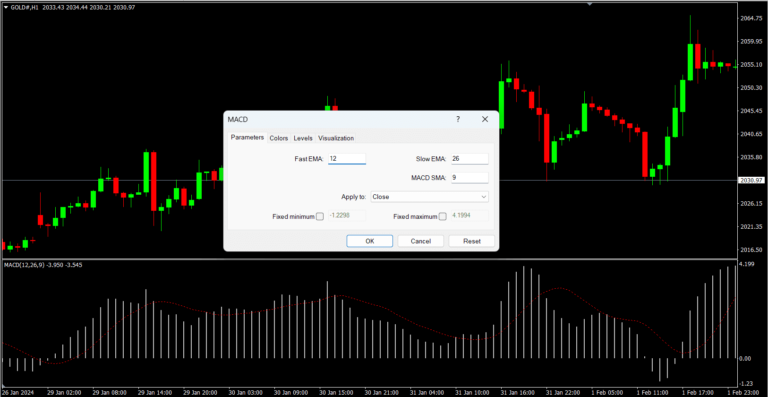
You can customize the settings as you like, but personally, I prefer to use the default values.
MACD is calculated by using the Exponential Moving Averages (EMA) of 26 and 12 periods, along with the Simple Moving Average (SMA) of 9 periods, and then displaying the result in the form of a histogram.
How to Trade Using MACD
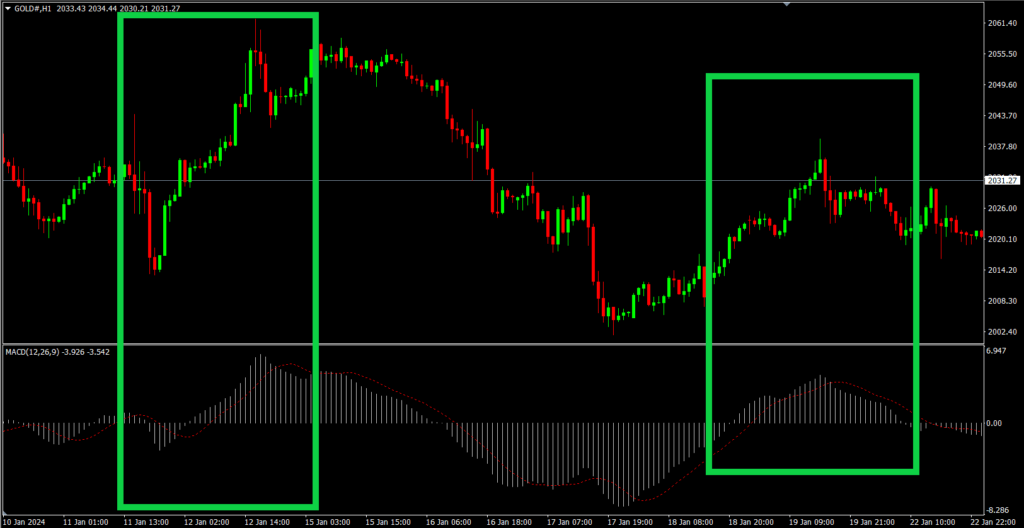
MACD is not an indicator used for opening orders directly, but it is a tool that traders commonly use to identify the price trend direction.
When the MACD forms a histogram above the zero line, or the average value is greater than 0, there is a chance that the price is in an uptrend. Traders use this point to consider entering a Buy order.
On the other hand, when the MACD forms a histogram below the zero line, or the average value is less than 0, there is a chance that the price is in a downtrend. Traders use this point to consider entering a Sell order.
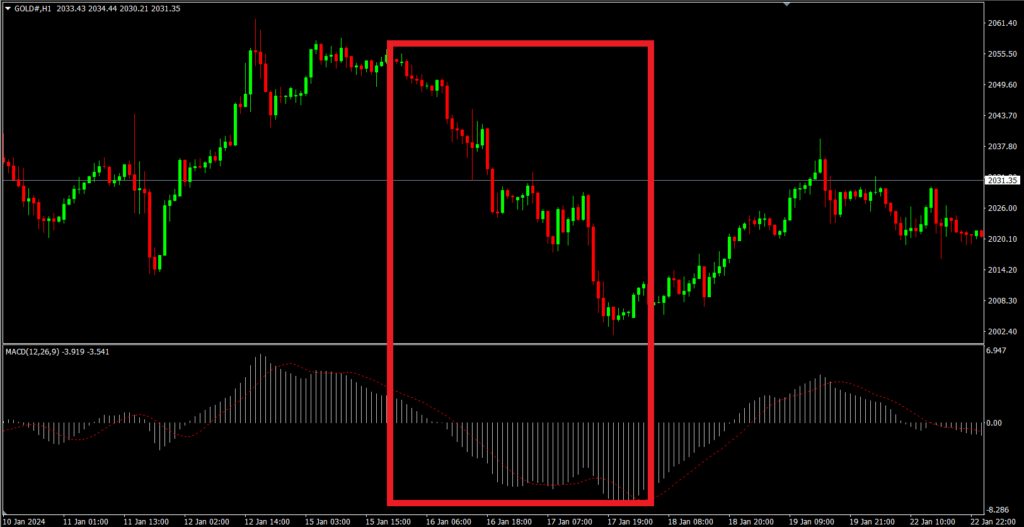
How to find MACD divergence
Another way to use MACD is to find price reversal points, which is called Divergence. A Divergence signal occurs when the direction of the price and the direction of the indicator do not match. For example, the price chart moves higher, but the MACD falls lower than before.
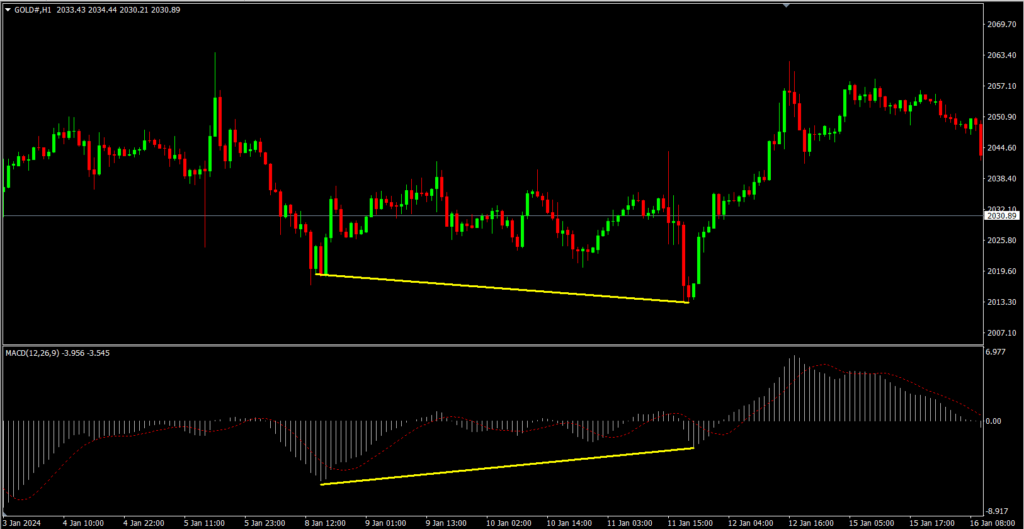
Bullish divergence
It is when the price chart creates lower lows consecutively, but the MACD chart forms higher lows. This shows that while the price is decreasing, the buying volume is actually increasing, which is a contradiction. Traders therefore anticipate that the price may reverse from an uptrend to a downtrend.
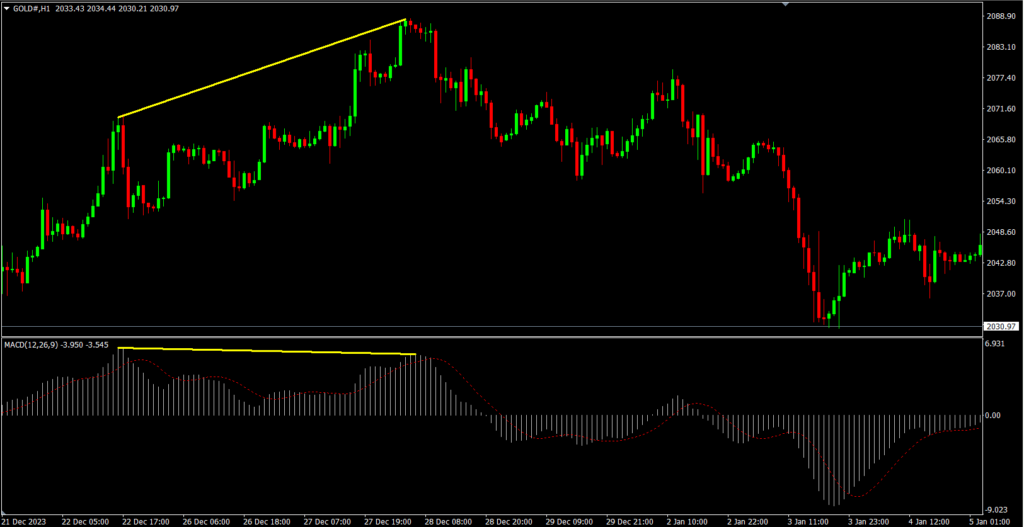
Bearish divergence
It is when the price chart forms higher highs consecutively, but the MACD chart creates lower highs. This shows that while the price is rising, the selling volume is decreasing, which is a contradiction. Traders therefore anticipate that the price may reverse from a downtrend to an uptrend.