What is the Relative Strength Index (RSI)?
RSI stands for Relative Strength Index. It is a tool used to measure the price momentum, indicating whether an asset is overbought or oversold.
How to activate RSI
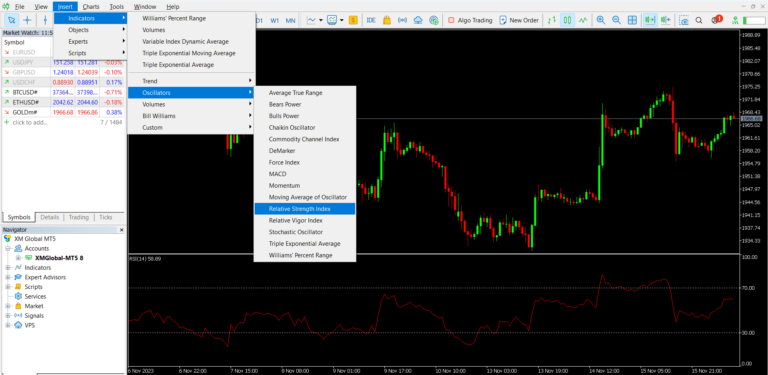
How to use: You can activate it in MT4 by going to Insert > Indicator > Oscillators > Relative Strength Index.
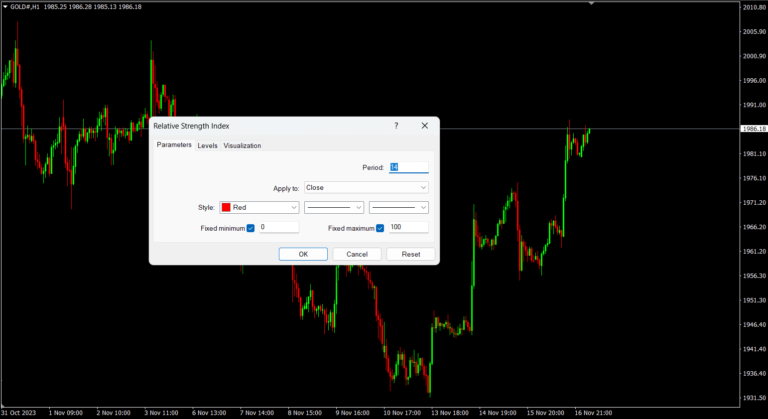
For the settings, you can use the default Period 14 that the system provides.
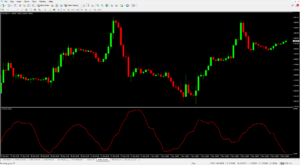
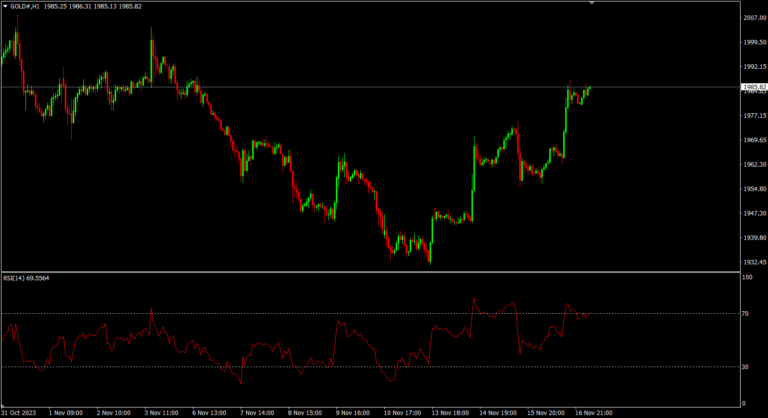
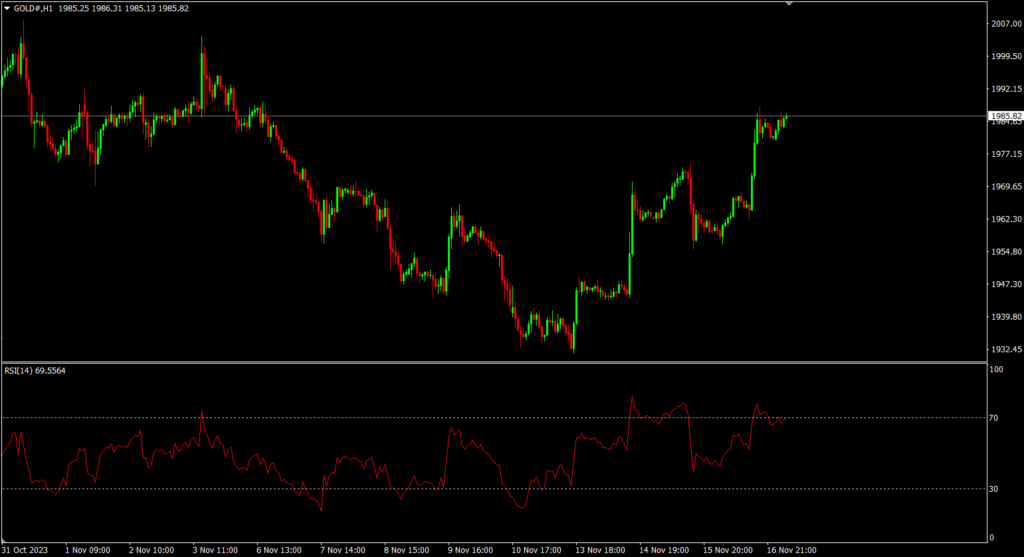
Then, the RSI indicator window will appear below the price chart. We use the RSI to observe the buying and selling pressure in the market during that period.
How to Trade Using RSI
1. Use it as a signal to open or close an order.
The way most traders use RSI for trading is to analyze the buying and selling pressure in the market to determine whether the current price is too high or too low. The RSI indicator divides its range into two main zones: Overbought and Oversold. Focus on the 30 and 70 levels in the indicator window.
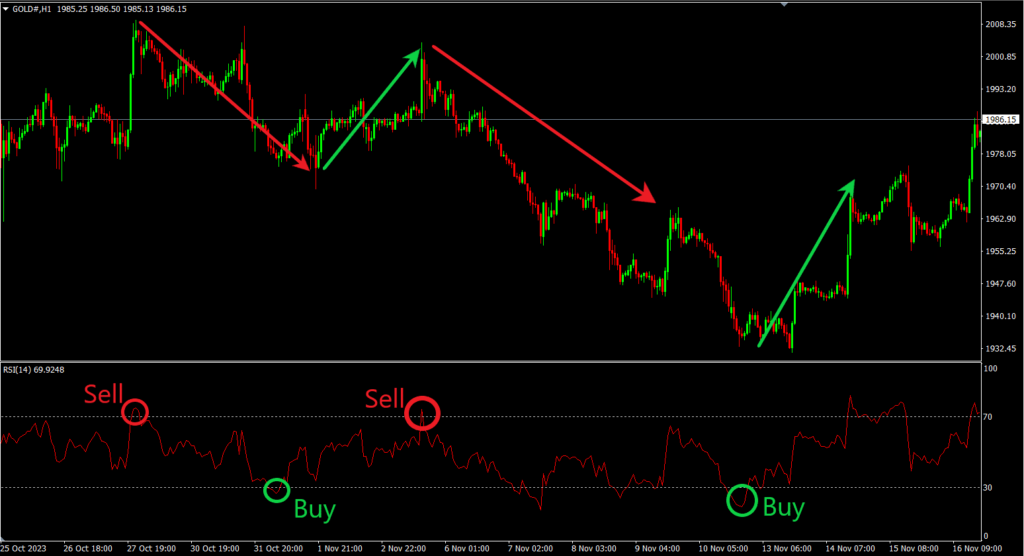
If the RSI line moves above 70, it indicates the market is in the Overbought zone, meaning there’s been heavy buying and the price is likely too high — which increases the chance of a price reversal to the downside. Traders may use this signal to look for Sell opportunities.
On the other hand, if the RSI drops below 30, it’s in the Oversold zone, indicating strong selling pressure and a potentially undervalued price, increasing the chance of a rebound. Traders may use this as a signal to look for Buy opportunities.
An easy way to remember this is:
“Above 70, consider selling.”
“Below 30, consider buying.”
However, results may not always align with the indicator alone. It’s important to consider other factors when opening a trade. For example, I personally use RSI mainly to find entry points in the direction of the trend. If the market is in an uptrend, I wait for RSI to dip into the Oversold zone before placing a Buy order. In a downtrend, I wait for RSI to rise above the Overbought zone before looking for Sell opportunities.
2. Used to identify signals of price reversal.
As mentioned earlier, RSI is a tool used to observe the buying and selling pressure in the market during a given period. This allows us to apply it in identifying potential price reversal points by looking for Divergence. Divergence occurs when the price chart movement does not align with the indicator, signaling a possible reversal.
Bullish Divergence
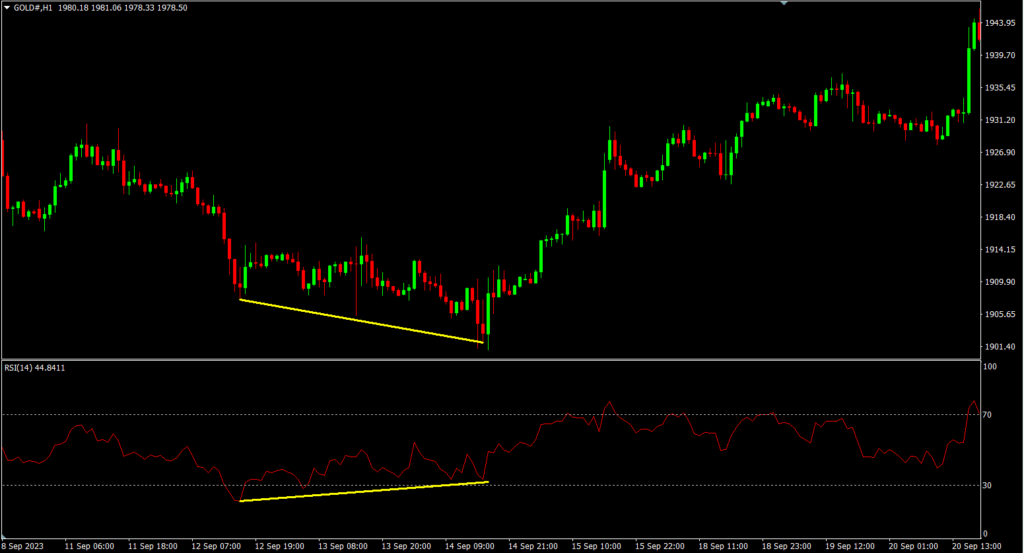
It occurs during a downtrend when the price continues to make new lower lows, but the indicator forms higher lows instead. This indicates that while the price is still declining, buying pressure in the market is increasing. As a result, there is a higher chance of a bullish reversal. Traders often use this signal to identify potential reversal points and open a “Buy” order.
Bearish Divergence
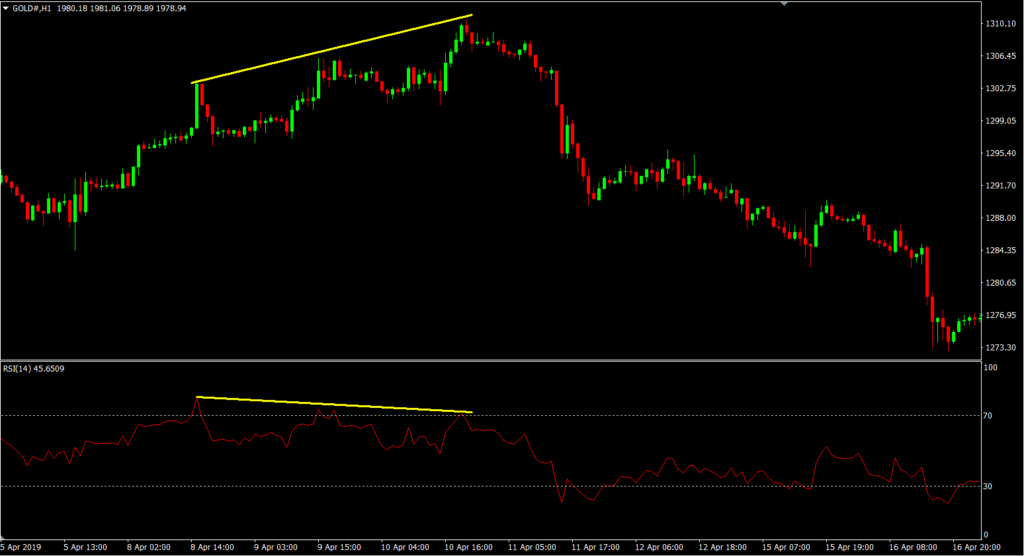
It occurs during an uptrend when the price continues to make new higher highs, but the indicator forms lower highs instead. This shows that while the price is still rising, buying momentum in the market is weakening. As a result, there is a higher chance of a bearish reversal. Traders often use this signal to identify potential reversal points and open a “Sell” order.