What is a Simple Moving Average (SMA)?
The Simple Moving Average (SMA) is a commonly used technical analysis indicator that helps identify trends in financial markets. It calculates the average price of an asset over a specified number of periods by adding the closing prices and dividing the total by the number of periods.
For example, to calculate a 10-day SMA, you add the closing prices of the past 10 days and divide the sum by 10. As each new day’s closing price is added and the oldest price is removed, the SMA line moves, reflecting the changing average price.
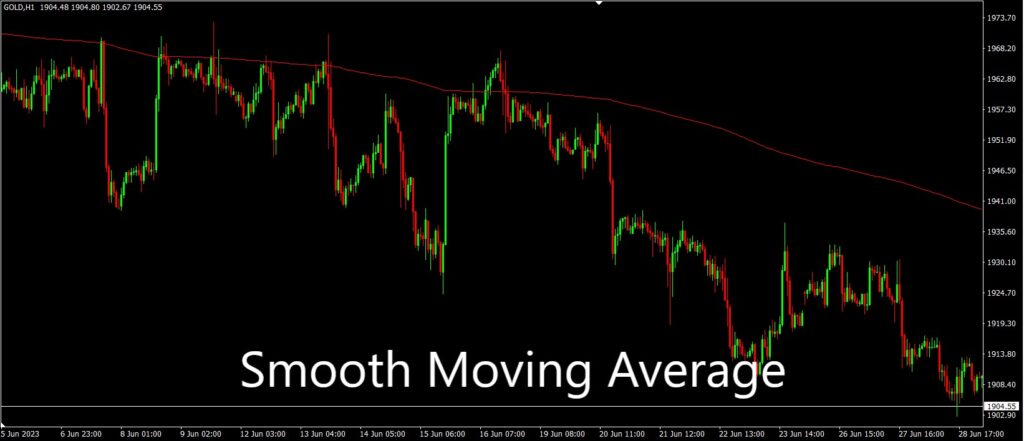
The SMA produces a smooth line that represents the average price over the chosen time frame. By smoothing out price fluctuations into a single line, the SMA helps traders more easily identify the overall direction of the market or asset. Traders and analysts often use SMAs of different time frames to assess market trends and potential support and resistance levels. Commonly used SMA time frames include the 50-day, 100-day, and 200-day SMAs for long-term analysis, while shorter time frames such as the 10-day or 20-day SMA are often used for short-term analysis.
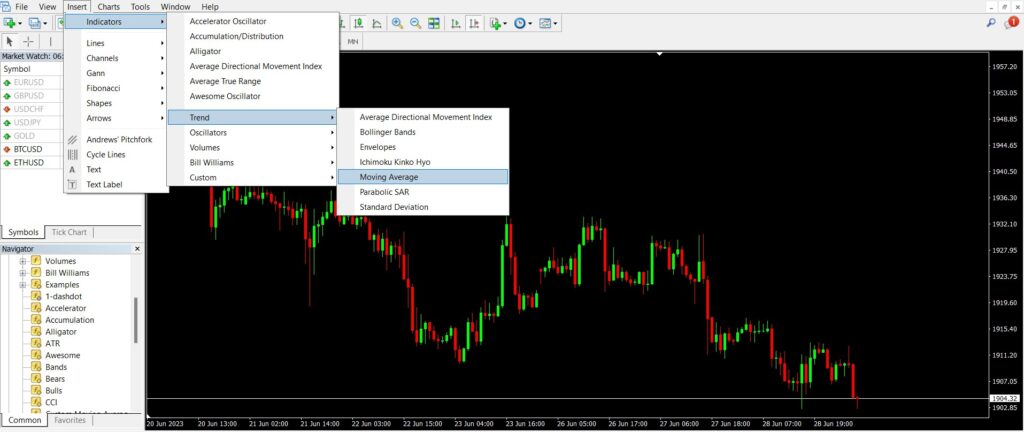
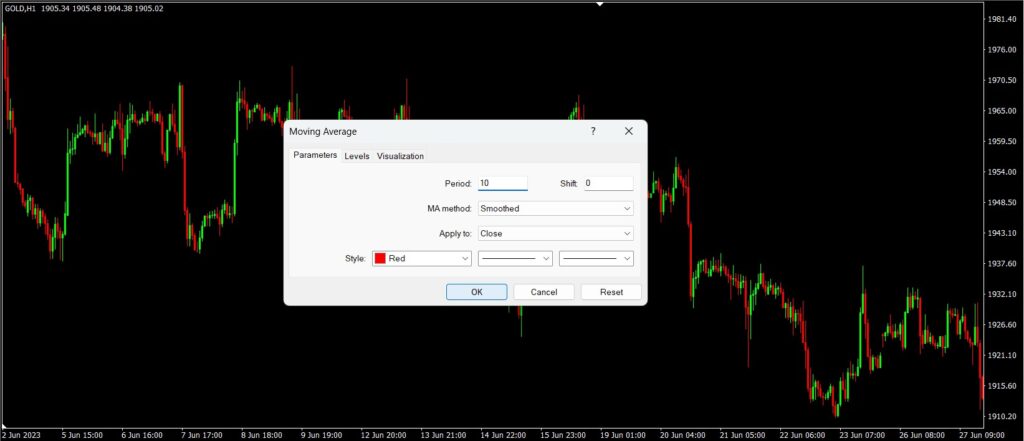
In MetaTrader 4 (MT4), you can enable the SMA by going to the menu: Insert > Indicators > Trend > Moving Average. The SMA is a type of Moving Average (MA), and by default, the MA method is set to Exponential. To use the SMA, simply change the MA method to Smoothed, and you will be able to display the SMA line on the chart.
How is the Simple Moving Average calculated?
How to calculate the Simple Moving Average (SMA):
To calculate the SMA, you add up the closing prices of an asset over a specified number of periods and then divide the total by the number of periods. For example, if you want to calculate a 10-day SMA, you sum the closing prices of the past 10 days and divide the result by 10.
The Simple Moving Average (SMA) is calculated by summing the closing prices of the asset over the specified periods and dividing the total by the number of periods. Below is a step-by-step process for calculating it:
Determine the number of periods you want to calculate the SMA for—for example, a 10-day SMA.
Gather the closing prices of the asset for the past 10 days. These prices could be daily closes or other relevant timeframes depending on your analysis.
Add up the closing prices over the 10-day period. For example, if the closing prices for the past 10 days are 10, 12, 14, 13, 15, 17, 16, 18, 19, and 20, then sum them: 10 + 12 + 14 + 13 + 15 + 17 + 16 + 18 + 19 + 20 = 154.
Divide the sum by the number of periods (10 in this case). Using the example above: 154 ÷ 10 = 15.4.
The result of this division is the Simple Moving Average. In this example, the 10-day SMA equals 15.4.
When a new closing price is added and the oldest price drops out, you recalculate the SMA using the updated set of closing prices to get the latest average price.
This calculation process applies to whatever timeframe or number of periods you select for the SMA. The result is a smooth average that reflects the price trend of the asset over the chosen period.
What is the purpose of using the Simple Moving Average?
The main purpose of using the Simple Moving Average is to identify trends and smooth out price volatility. Traders and analysts use the SMA to assess the overall direction of the market or a specific asset and to determine potential support and resistance levels.
Example of using SMA
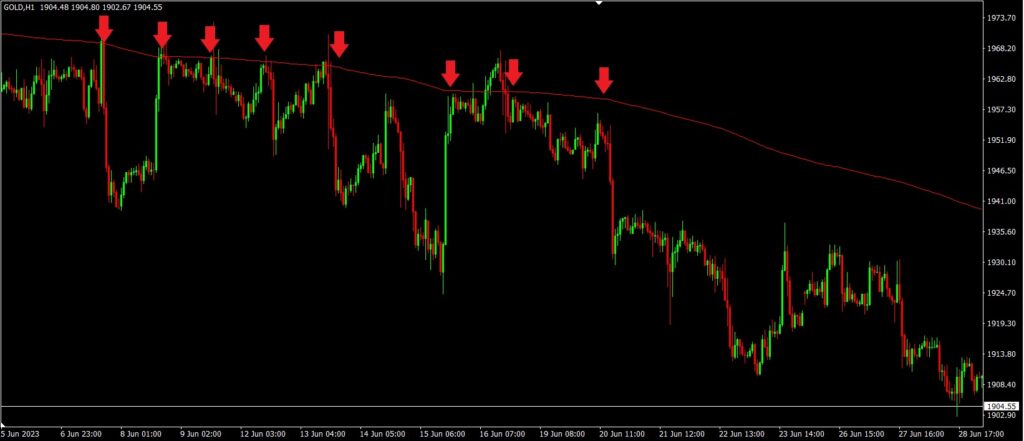
Trend Identification: SMA helps determine the overall direction of the market or a specific asset. By calculating the average price over a set period, the SMA smooths out short-term price fluctuations, making it easier to identify the prevailing trend. When the price consistently stays above the SMA line, it indicates an uptrend, while a price consistently below the SMA suggests a downtrend.
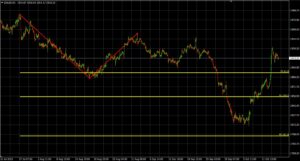
Support and Resistance Levels: The SMA can act as dynamic support or resistance. Traders often use the SMA to identify potential entry or exit points for trades. For example, if the asset’s price approaches the SMA from below and then falls back down, the SMA may act as resistance. Conversely, if the price approaches the SMA from above and then bounces back up, the SMA may serve as support.
Price Reversal Signals: Crossovers of different SMAs can provide signals of potential price reversals. For example, when a short-term SMA (such as the 50-day) crosses above a long-term SMA (such as the 200-day), it is often considered a bullish signal, indicating a possible trend reversal or upward momentum. Conversely, when the short-term SMA crosses below the long-term SMA, it may signal a bearish trend.
Confirmation with Other Indicators: SMA is often used in conjunction with other technical indicators to strengthen trading signals. Traders may use indicators such as the Moving Average Convergence Divergence (MACD), Relative Strength Index (RSI), or other oscillators alongside the SMA to gain additional insights into market conditions and improve the accuracy of their analysis.
Please remember that although the SMA is useful for trend analysis and generating trading signals, it should not be used as the sole basis for making trading decisions. It is important to consider other factors such as market fundamentals, additional technical indicators, and risk management techniques to develop a comprehensive trading strategy.
What are the commonly used timeframes for Simple Moving Averages?
Simple Moving Averages (SMA) can be calculated over various timeframes depending on the trading strategy and the level of analysis desired.
Short-term timeframes: For short-term analysis, traders often use SMAs calculated over relatively small periods, such as 5, 10, or 20 days. These shorter timeframes are suitable for capturing immediate price movements and identifying short-term trends or patterns.
Medium-term timeframes: Medium-term SMAs are typically used to assess intermediate trends of an asset. Timeframes ranging from 50 to 100 days are commonly used for this purpose. The 50-day and 100-day SMAs are popular choices among traders.
Long-term timeframes: Long-term SMAs are useful for identifying major trends and understanding overall market sentiment. Generally, timeframes like 100, 200, or more than 200 days are used for long-term analysis. The 200-day SMA is especially important as it is widely followed and regarded as a key indicator by many traders and investors.
It is important to note that these timeframes are not fixed and may vary depending on the asset being analyzed and the specific strategy or preference of the trader. Some traders use different SMAs combined with various timeframes to get a comprehensive market view and generate more effective trading signals. Additionally, adjusting the timeframe can change the sensitivity of the SMA to price changes: shorter timeframes respond more quickly and provide more frequent signals, while longer timeframes offer a smoother view of the trend.
Can Simple Moving Averages be used in all market conditions?
Simple Moving Averages (SMA) are indicators that work best in trending markets, where price movements are clear and sustained in one direction. Under such conditions, SMA can help traders identify and follow trends, potentially leading to profitable trading opportunities. However, its effectiveness can vary depending on different market conditions. For example, in strong and sustained trending markets, SMA tends to perform well by smoothing out price volatility and indicating a clear trend direction.
Traders can use SMA to identify potential entry and exit points in the direction of the trend. But in markets without a clear trend—such as sideways or ranging markets—the SMA may produce false signals or unclear information, making it less reliable for trend identification or generating trading signals.
To improve the effectiveness of SMA in various market conditions, traders often combine it with other indicators or additional analytical methods. This approach provides a more comprehensive view of the market and helps confirm signals generated by the SMA. Additionally, applying proper risk management techniques, such as setting stop-loss orders and managing position sizes, can reduce risks associated with different market environments.