What is the Stochastic Oscillator?
The Stochastic Oscillator was developed by George C. Lane in the late 1950s. It is used to analyze price trends and potential reversals, and it can also identify overbought and oversold levels.
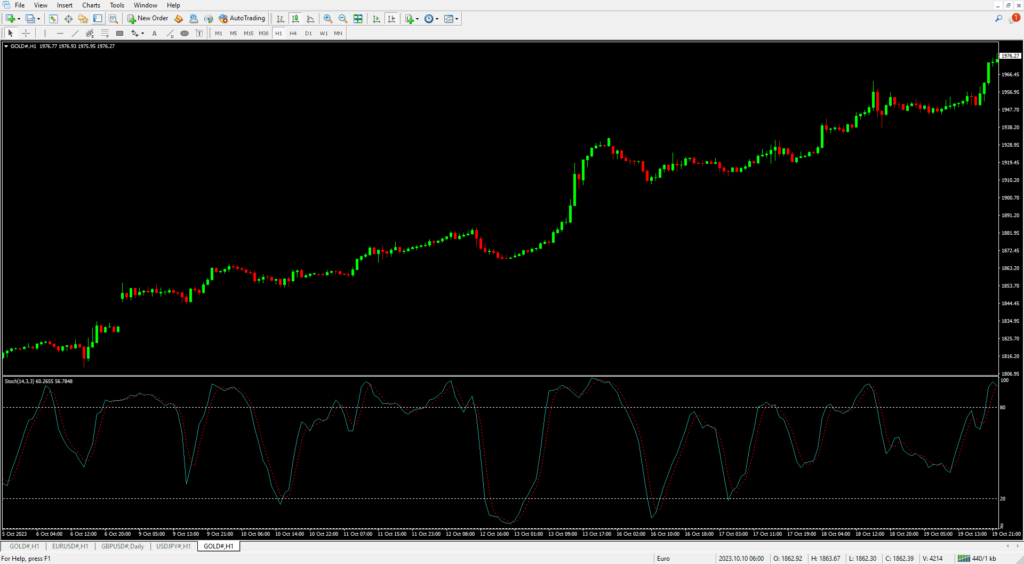
The Stochastic Oscillator indicates historical price performance based on a specified period. For example, setting it to 14 on a 1-hour chart means it analyzes the past 14 hours. The Stochastic Oscillator consists of two lines—%K and %D—that move between the range of 0 to 100. These two lines can be applied to any chart and help traders make informed decisions.

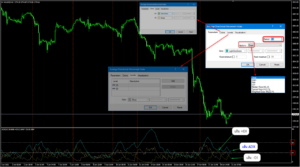
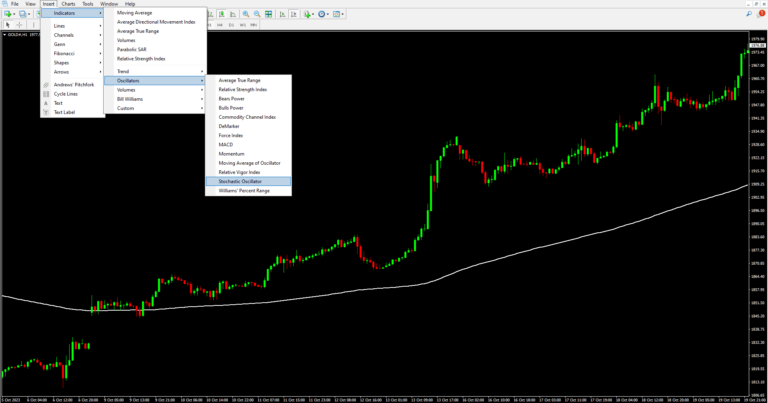
How to activate the Stochastic Oscillator.
You can activate it directly on MT4 or MT5 by going to:
Insert > Indicators > Oscillators > Stochastic.
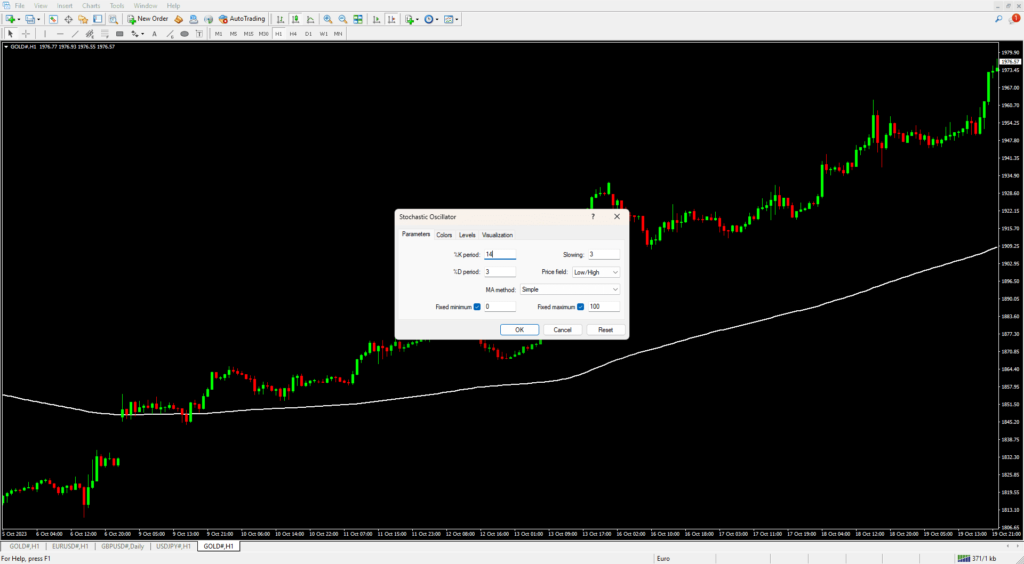
Stochastic Oscillator Settings
The default settings provided by the system are 5, 3, 3. However, the settings commonly preferred by many traders for the Stochastic Oscillator are 14, 3, 3 and 21, 5, 5. I recommend using 14, 3, 3.
Stochastic Oscillator Calculation Formula
The calculation formula for the Stochastic Oscillator is:
%K = (Current Close – Lowest Low) / (Highest High – Lowest Low) × 100
%D = 3-day Simple Moving Average (SMA) of %K
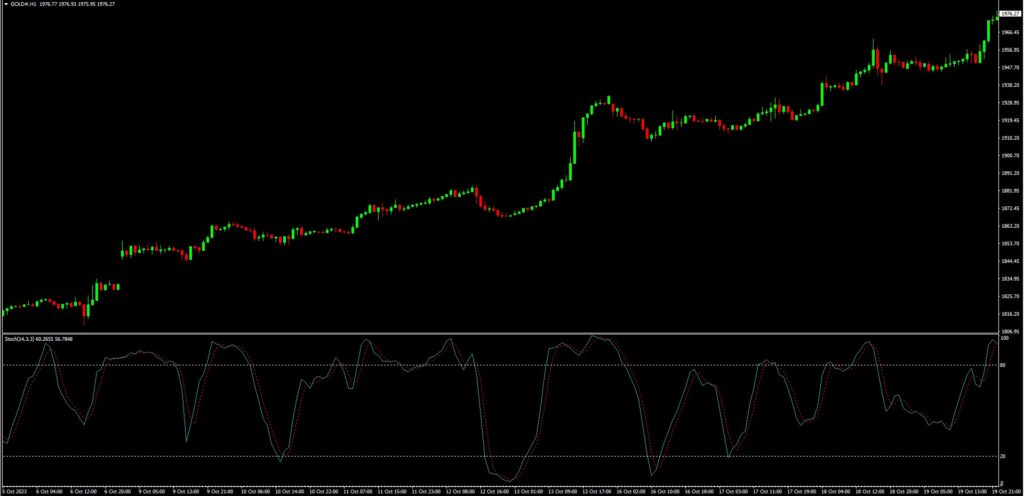
The Stochastic Oscillator moves between 0 and 100. However, prices rarely reach exactly 0 or 100, so traders commonly use the levels 20 and 80 as indicators of oversold and overbought conditions, respectively.
How to Trade Using the Stochastic Oscillator
If the Stochastic value is above 80, it is considered an overbought condition, meaning there have been many buyers. This increases the chance that the price will pause and reverse downward. Traders use this as a signal to sell. Conversely, if the Stochastic value is below 20, it is considered an oversold condition, meaning there have been many sellers. This increases the chance that the price will pause and reverse upward. Traders use this as a signal to buy.
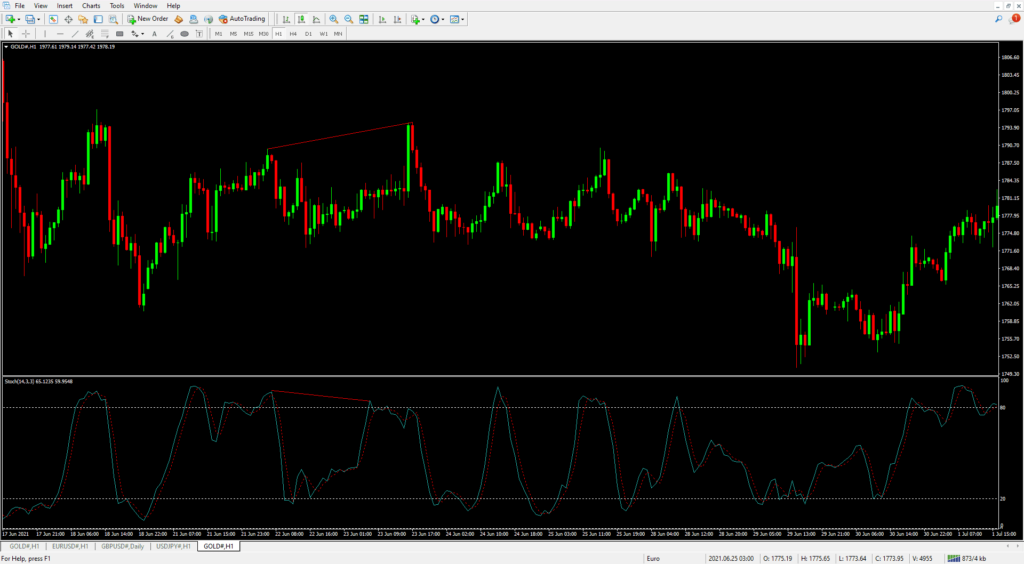
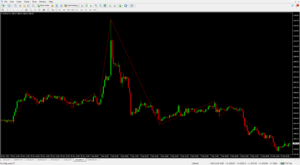
In addition, like other oscillators, the Stochastic can also indicate divergence. Divergence occurs when the price chart conflicts with the indicator. For example, in the image, the price makes a new high, but the Stochastic shows fewer buyers than before. This is a sign of divergence, meaning the price might reverse downward.
However, the Stochastic is not 100% accurate; it is just a tool to help traders analyze their entry and exit points. I recommend studying other indicators as well to support your trading decisions, as there may be other indicators that suit you better.