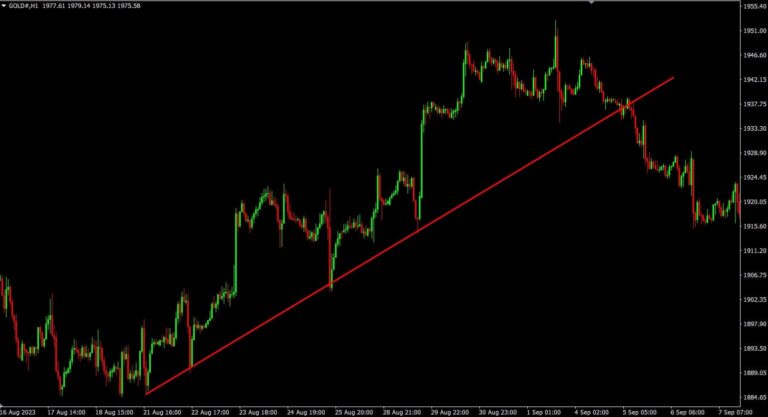
What is a Trendline?
A trendline is a straight line that connects two or more price points on a chart to identify and confirm trends in technical analysis. Trendlines are a basic tool used by traders to recognize and predict price movement patterns in the market. Essentially, a trendline functions like a support or resistance line, but it is drawn at an angle.
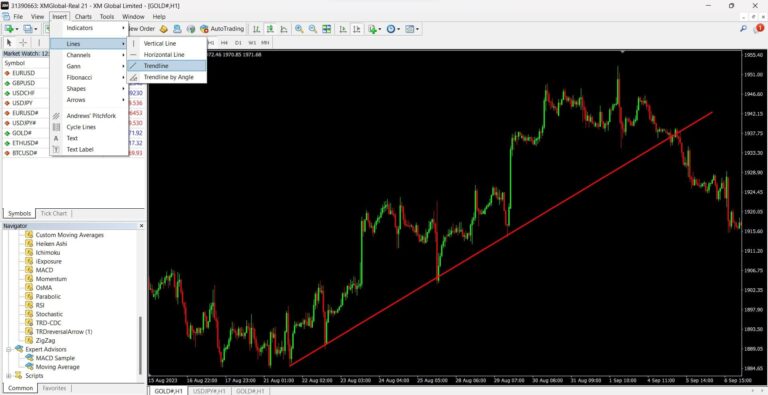
How to Use a Trend Line
You can enable it in MT4 by going to the menu Insert > Lines > Trendline.
Next, identify the current trend. To draw a trendline, you need at least two reference points and a clear trend. For an uptrend, draw the trendline from the first Swing Low to the next Swing Low, or from point A to B, then extend it further to predict potential support levels. This way, you will have your trendline established.
How to Trade Using Trendlines
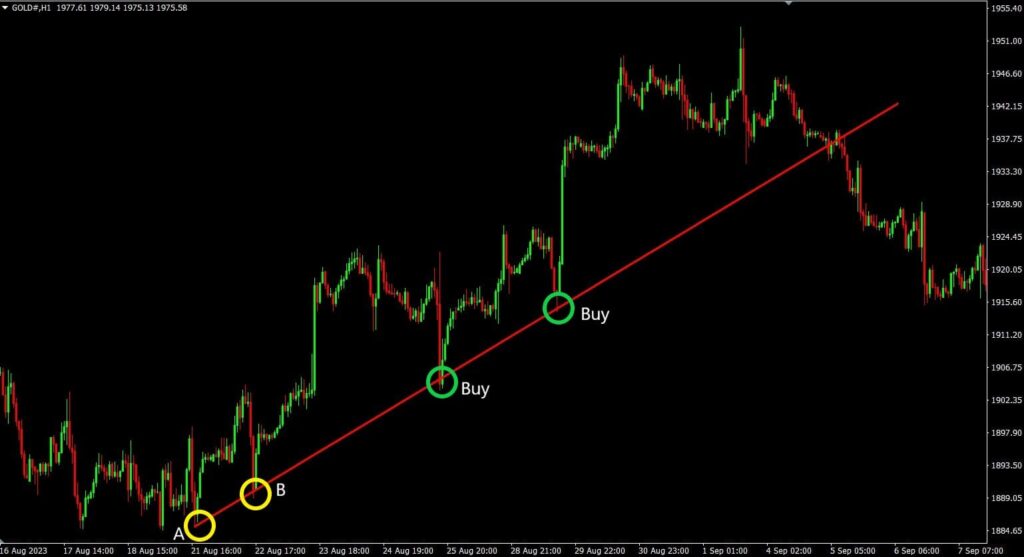
A trendline can only be drawn when the market shows a clear trend, meaning it is only applicable during an uptrend or downtrend. In the example of an uptrend, at first, you might only see points A and B. You draw the trendline from point A to point B, or from the previous Swing Low to the current Swing Low, then extend the line to project a support level where the price is likely to bounce when it pulls back to the trendline. Traders use this trendline as an entry point to open a Buy order when the price touches the line. The trendline can also help assess the strength of the trend.
In the case of a downtrend, the trendline is drawn from the previous Swing High to the latest Swing High, acting as a resistance line. The method is similar to that for an uptrend, but applied in reverse.