What is a Triple Top and Triple Bottom?
A Triple Top and Triple Bottom is a price reversal pattern that occurs when the price hits a support or resistance level three times before reversing direction—either from an uptrend to a downtrend or vice versa. The Triple Top and Triple Bottom pattern functions similarly to the Double Top and Double Bottom, but with the addition of a third peak (Top 3) or a third trough (Bottom 3). Traders often use this reversal point to plan their entries for potential profit.
What is a Triple Top?
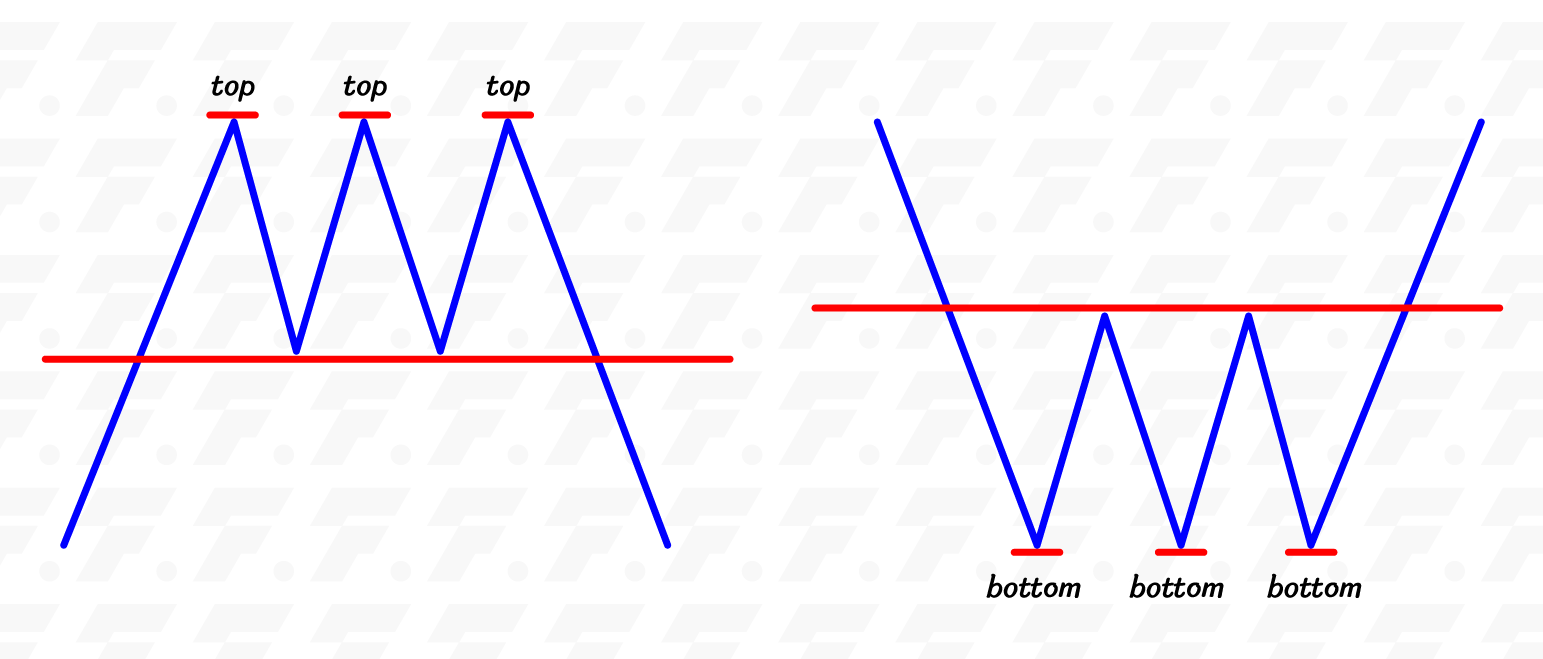
A Triple Top is a reversal pattern that typically appears in an uptrend and may signal a potential trend reversal to the downside. This pattern forms after the price continuously makes higher highs, starting with the first swing high (Top 1), followed by a pullback creating a swing low. The price then moves up again to a level near the previous high (Top 2), before pulling back once more to a swing low that is close to the previous swing low. Finally, the price rallies a third time to a level near the two previous highs (Top 3) and then pulls back again.
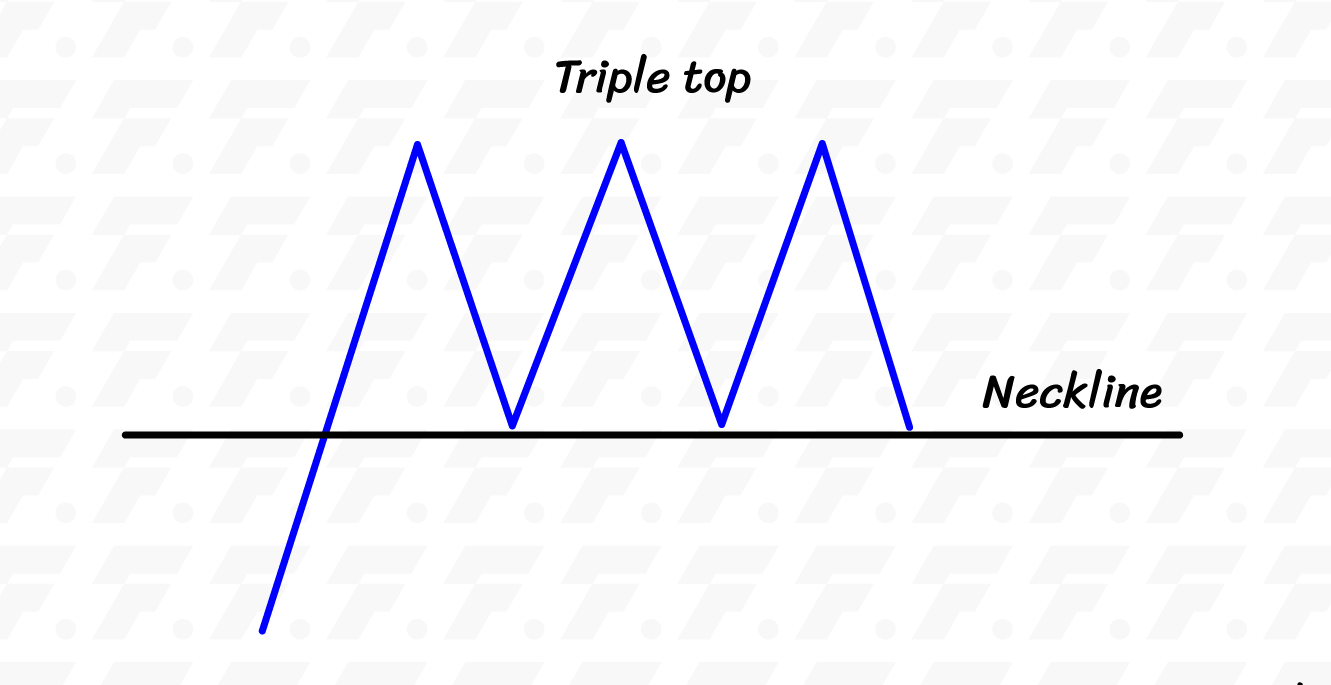
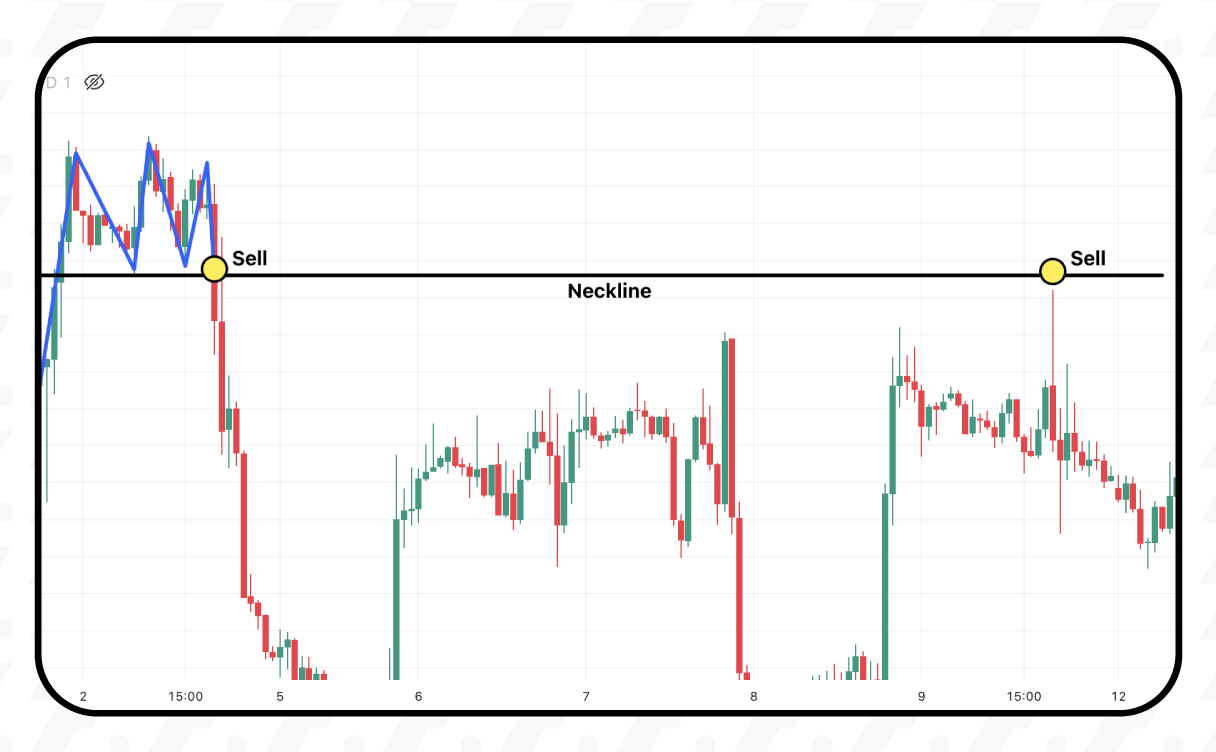
When trading with the Double Top pattern, if the chart is in an uptrend (making higher highs continuously) and the pattern as described is identified, traders should draw a neckline at the lowest point (Swing Low) between the two highs. A Sell order can be placed once the price breaks below the neckline. Alternatively, traders can wait for the price to break below the neckline and then retest it—if the price comes back up to touch the neckline again, a Sell order can be placed at that point.
What is a Triple Bottom?
A Triple Bottom is a price reversal pattern that typically appears during a downtrend and may indicate a potential shift to an uptrend. The pattern forms after the price continues to make lower lows and then creates a Swing Low (Bottom 1) at a new low point, followed by a rebound to form a Swing High. The price then falls again to a level near the previous low (Bottom 2), followed by another upward movement to a Swing High close to the previous one. Finally, the price dips once more to a level near the first two lows (Bottom 3) before making a strong upward move.
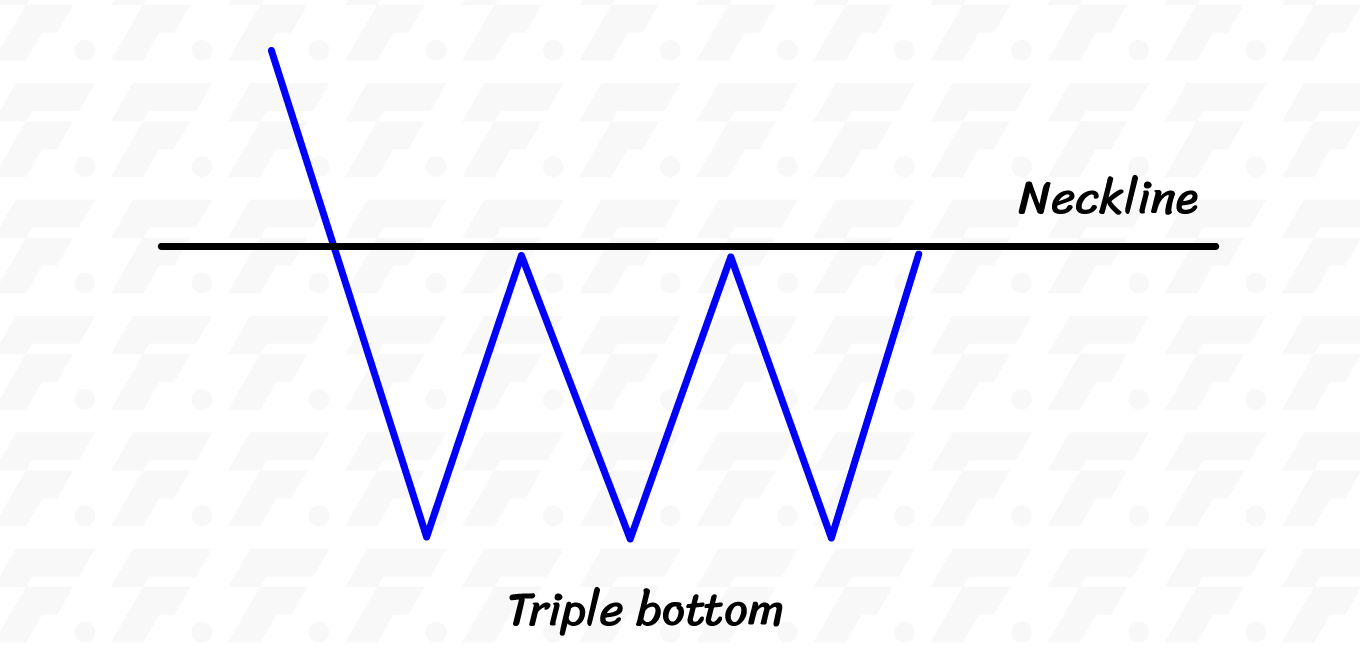
When trading with the Double Bottom pattern, if the chart is in a downtrend (continuously making lower lows) and the pattern described above is observed, traders should draw a Neckline at the highest price point (Swing High) between the two bottoms. A Buy order can be placed once the price breaks above the Neckline, or alternatively, a Buy order can be placed after the price breaks above the Neckline and then pulls back to retest the Neckline before continuing upward.
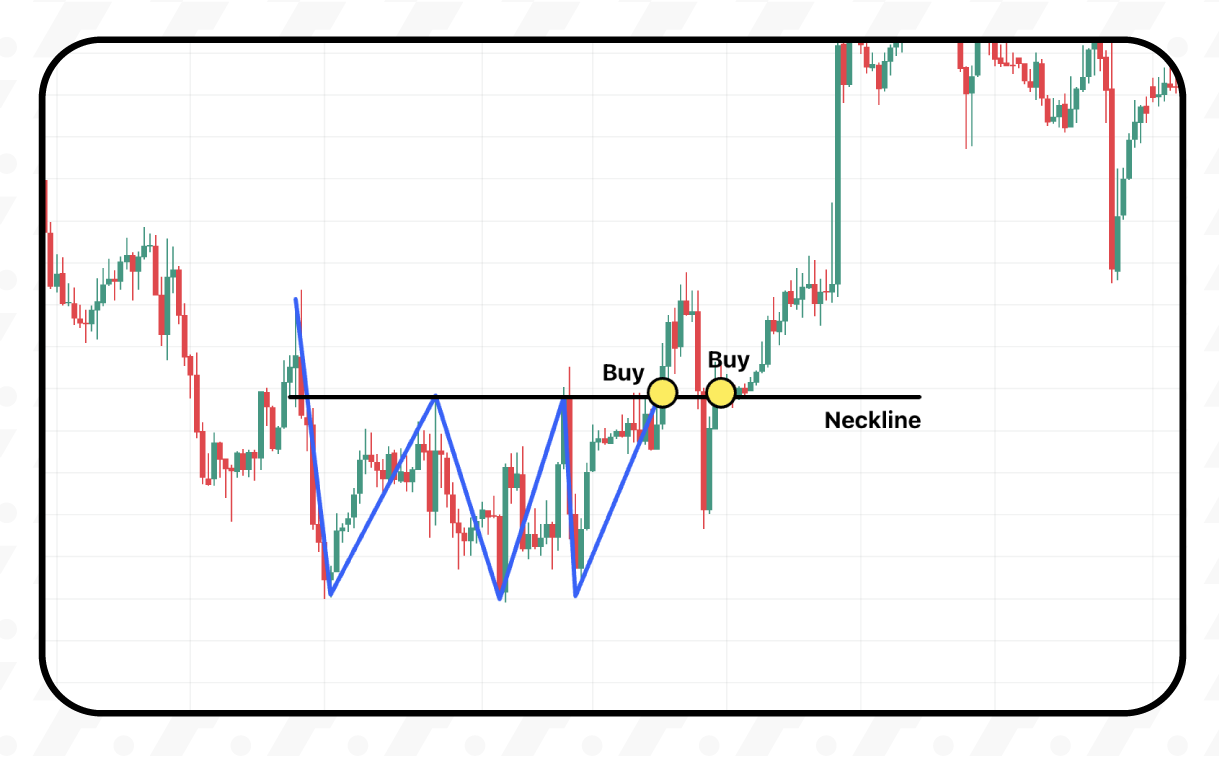
Observing chart patterns such as Double Top or Double Bottom can provide strong reversal signals. After the price breaks out of the Neckline — either from the highest or lowest point — and then pulls back to retest the Neckline, the line often turns into a support or resistance level. If the price fails to break through the Neckline again, there is a high probability that the chart will reverse and shift into a new trend direction.

