What is the Money Flow Index?
MFI, or Money Flow Index, is an indicator categorized under Volumes that is used to analyze price movements and the trading volume of a security. It helps to check whether there is sufficient buying and selling activity in the market, assisting traders in making decisions on whether to open buy or sell orders.
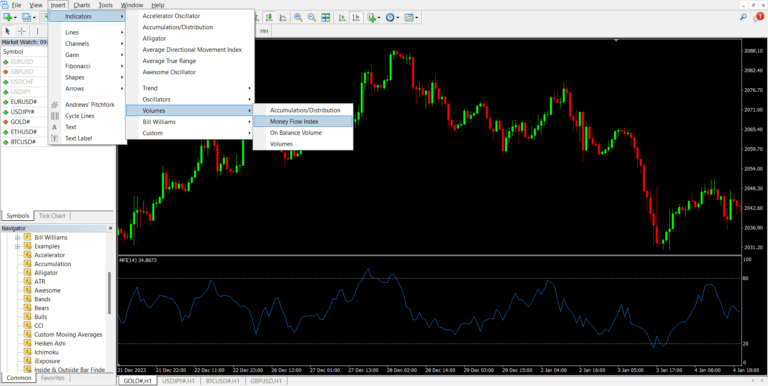
How to activate Money Flow Index (MFI)
You can activate Fractals on MT4 and MT5 by going to Insert > Indicator > Bill Williams > Fractals.
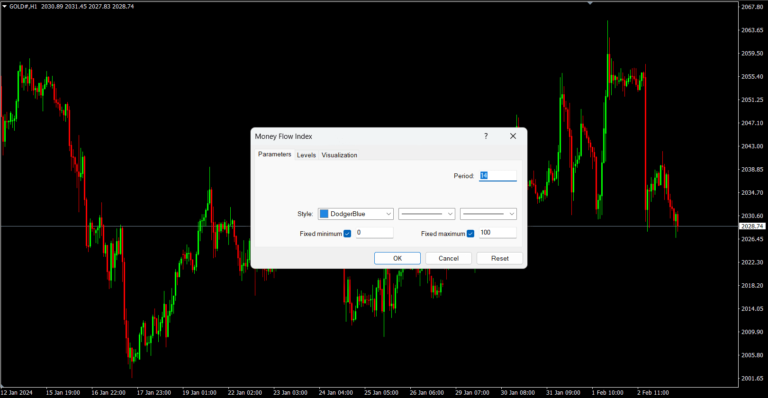
You can customize the color and size as you wish.

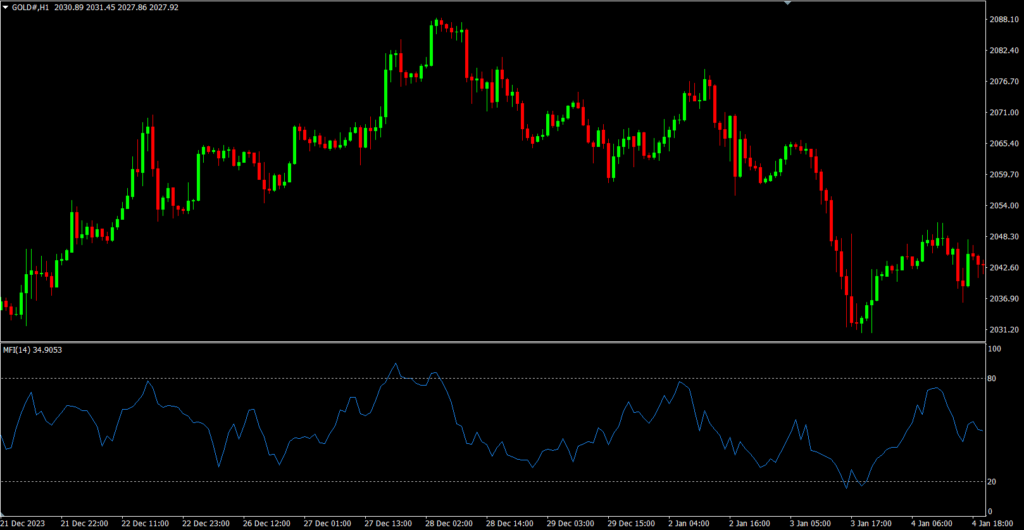
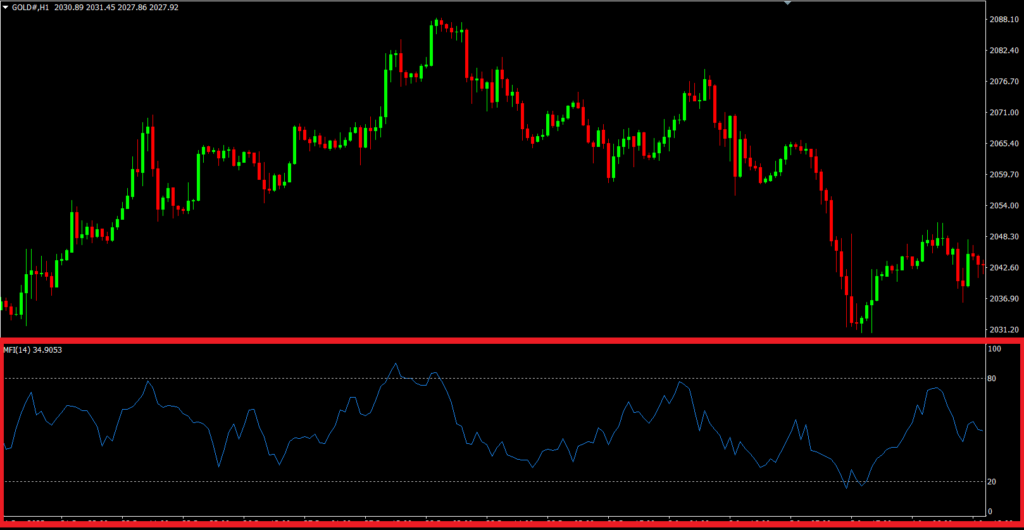
When you open the MFI, an indicator window will appear at the bottom, showing the movement of money in the market by using price and trading volume. The values are divided into two zones: Overbought at 80 and above, and Oversold at below 20.
Characteristics of the Money Flow Index (MFI)
MFI is an indicator that shows the trading volume in the market displayed as a graph. It is divided into two zones: Overbought (excessive buying volume) and Oversold (excessive selling volume), which is very similar to the RSI.
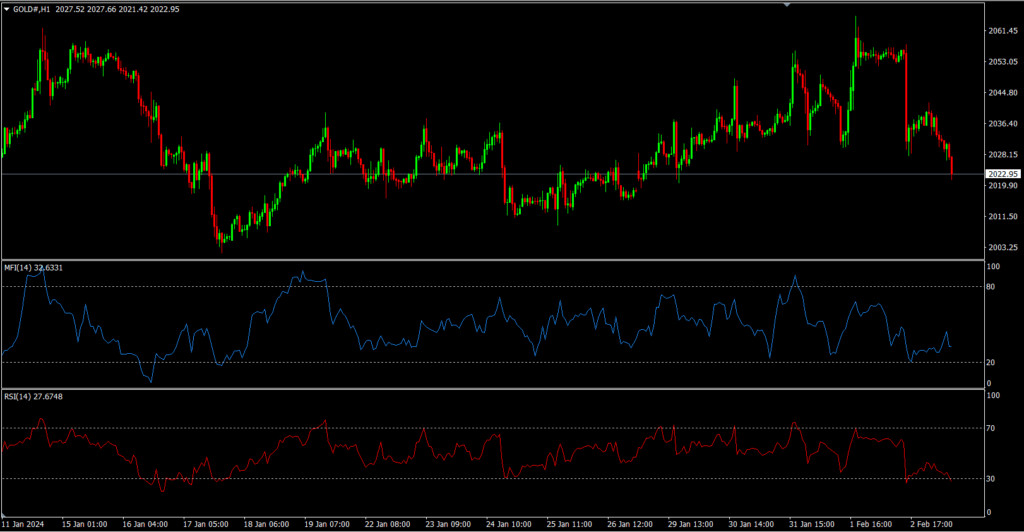
The characteristics of the MFI are very similar to the RSI, as both divide zones into Overbought and Oversold. However, there are some important differences:
Purpose of use:
MFI (Money Flow Index): Designed to measure the flow of money in the market by using both price and trading volume.
RSI (Relative Strength Index): Measures the strength of price movement using the average price changes.
Data used for calculation:
MFI: Uses high price, low price, close price, and trading volume.
RSI: Uses only the closing price.
Value ranges:
MFI: Ranges from 0 to 100, typically giving signals when above 80 or below 20.
RSI: Also ranges from 0 to 100, but usually gives signals when above 70 or below 30.
How to calculate the Money Flow Index (MFI)
Money Flow (MF): Calculate the Money Flow by multiplying the closing price of each day by the trading volume. This value can be positive or negative depending on the price movement.
MF = Volume × Closing Price
Money Ratio (MR): Calculate the Money Ratio by dividing the positive money flow by the total money flow over the specified period.
MR = Positive Money Flow / Total Money Flow
Money Flow Index (MFI): Calculate the MFI by applying the Money Ratio in the formula below and multiplying by 100.
MFI = 100 – (100 / (1 + MR))
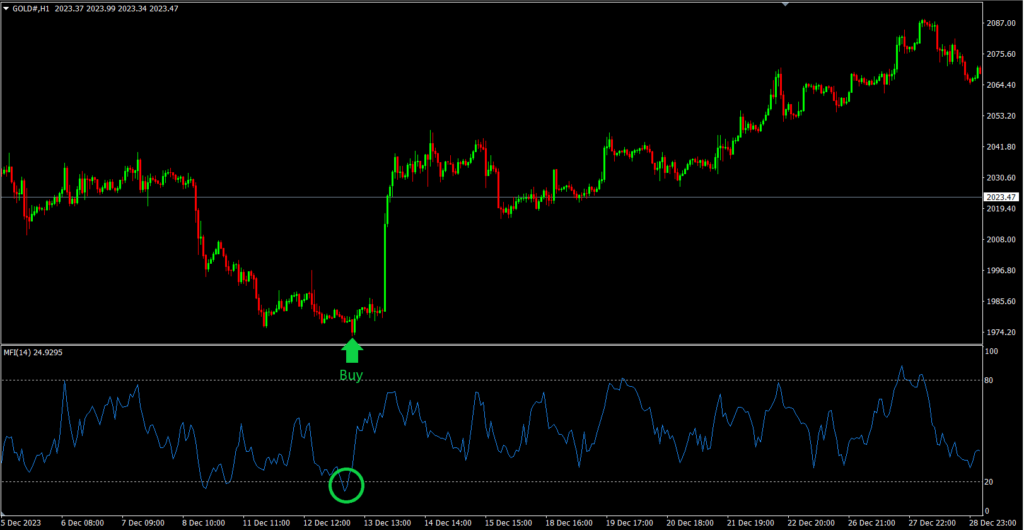
How to Trade Using the Money Flow Index (MFI)
The way to use the MFI is very similar to the RSI. We mainly trade based on the trend. If the MFI is below 20, it is in the oversold zone, indicating that selling pressure in the market is high and the price is expected to rebound. Traders use this point as a signal to consider opening a Buy order.
On the other hand, the arrow below, or the Bullish fractal:
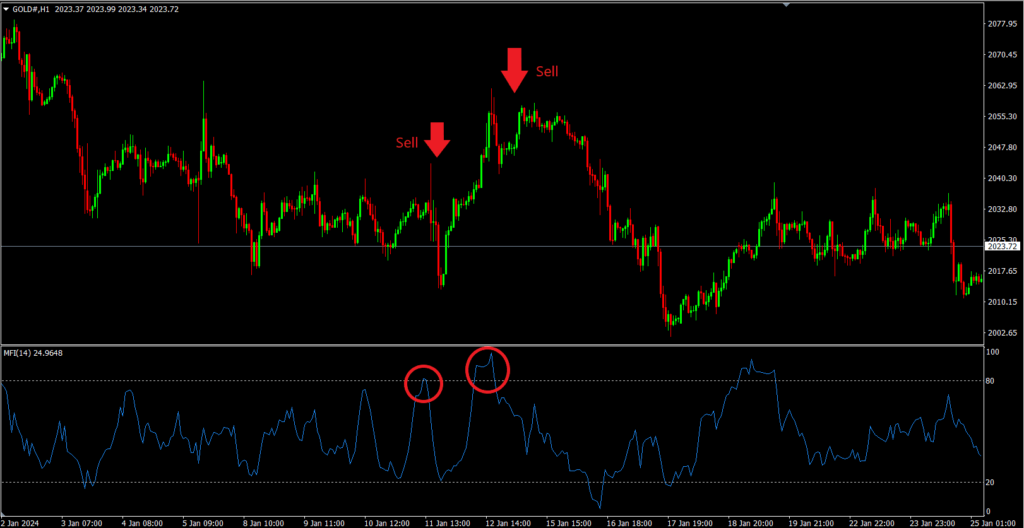
If the MFI value is above 80, it is in the overbought zone, indicating that buying pressure in the market is high and the price is expected to decline. Traders use this point as a signal to consider opening a Sell order.
How to Identify Divergence with the Money Flow Index (MFI)
In addition to analyzing buying and selling volume to open orders according to the trend, MFI can also be used to identify potential price reversals or divergences. As mentioned earlier, MFI tracks the volume of buying and selling, which allows us to observe the consistency of price behavior as well.
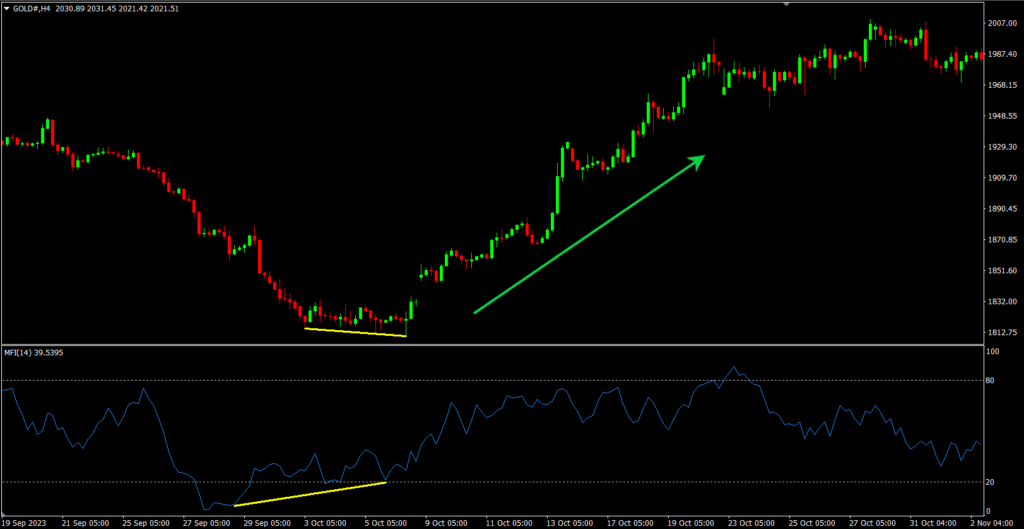
Bullish Divergence
Bullish Divergence usually occurs during an uptrend. You will notice that the price makes higher highs as expected in a natural uptrend, but the MFI decreases, indicating a reduction in buying volume that contradicts the price movement. Traders interpret this as a potential signal that the price may reverse and move downward in the future.
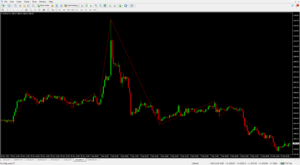
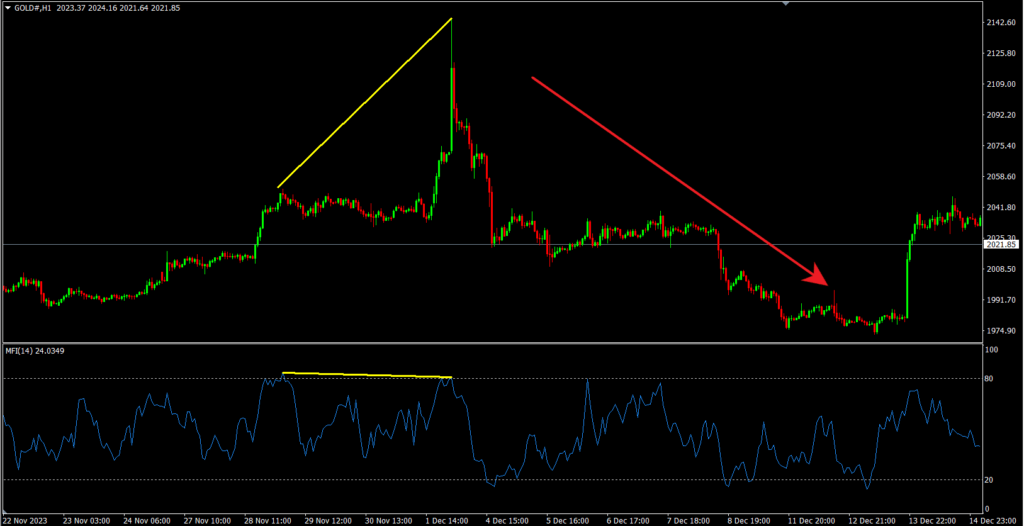
Bearish Divergence
Bearish Divergence usually occurs during a downtrend. You will notice that the price makes lower lows as expected in a natural downtrend, but the MFI rises, indicating an increase in buying volume that contradicts the price movement. Traders interpret this as a potential signal that the price may reverse and move upward in the future.